[ad_1]
Fall to $25k could happen quickly.
Forex Brokers We Recommend in Your Region
See full brokers list
My previous BTC/USD signal on 8th June was not triggered as none of the key support or resistance levels were reached that day.
Risk 0.50% per trade.
Trades may only be entered before 5 pm Tokyo time Thursday.
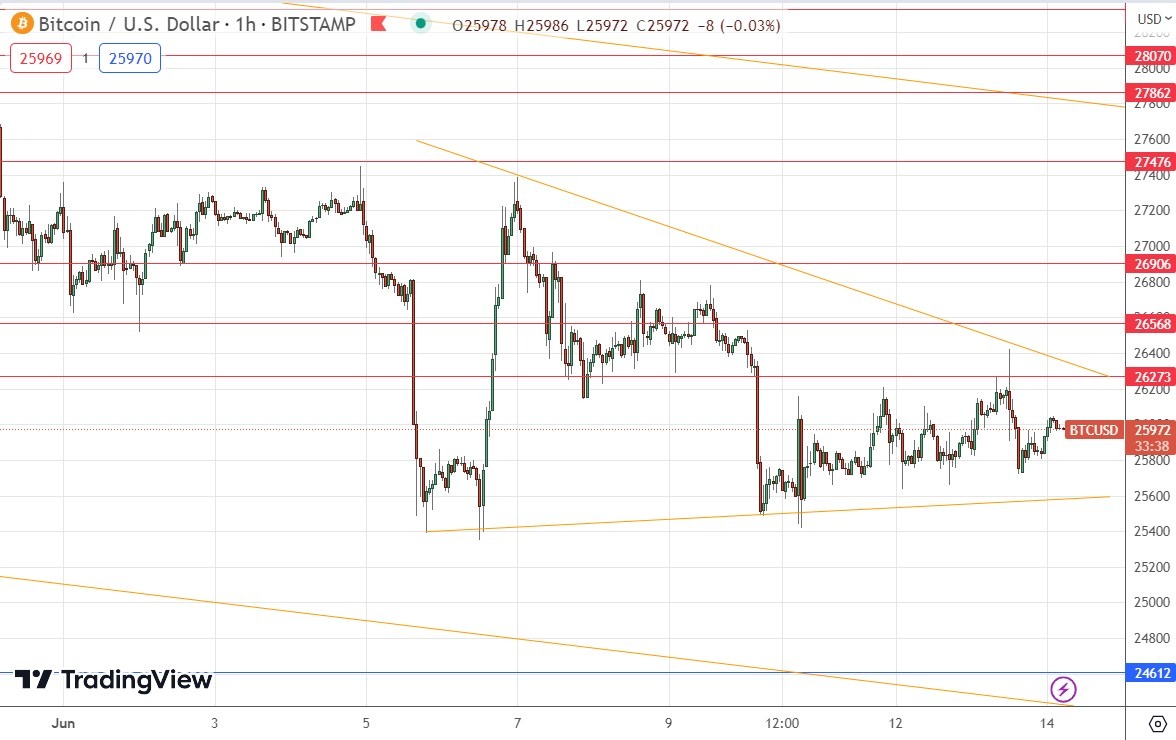
- Go long after a bullish price action reversal on the H1 timeframe following the next touch of $24,612.
- Put the stop loss of $100 below the local swing low.
- Move the stop loss to break even once the trade is $100 in profit by price.
- Take off 50% of the position as profit when the trade is $100 in profit by price and leave the remainder of the position to ride.
- Go short after a bearish price action reversal on the H1 timeframe following the next touch of $26,273, $26,568, or $26,906.
- Put the stop loss $100 above the local swing high.
- Move the stop loss to break even once the trade is $100 in profit by price.
- Take off 50% of the position as profit when the trade is $100 in profit by price and leave the remainder of the position to ride.
The best method to identify a classic “price action reversal” is for an hourly candle to close, such as a pin bar, a doji, an outside or even just an engulfing candle with a higher close. You can exploit these levels or zones by watching the price action that occurs at the given levels.
I wrote in my previous BTC/USD analysis on 8th June that the price remained falling within the wide descending price channel, with the support level at $26,003 looking likely to be the pivotal point of the day.
This was a good call in a sense, as the price remained above that support level.
The technical picture has not changed over the long or medium terms – the price is still showing long-term bearishness and slowly descending within the wide bearish price channel which can be seen within the price chart below.
However, there is a new technical feature that will probably be influential – a narrowing triangle chart pattern which has formed well within the price channel to contain the current price.
The descending upper line of the triangle looks likely to be strong as it has three resistance levels near it, just above it. On the other hand, the price keeps bouncing along near the lower trend line of the triangle which is much flatter, and which looks weaker.
The triangle looks likely to see a breakdown, and this is also telegraphed by the dominant bearish price channel.
Therefore, I think if we get two consecutive hourly closes later below the lower trend line of the triangle at about $25,600, we can expect the price will continue to move down to the next support level at $24,600.

Concerning the US Dollar there will be a release of US PPI data at 1:30 pm London time, followed by the Federal Funds Rate, Rate Statement, and Economic Projections by the Fed at 7 pm.
Ready to trade our daily Bitcoin signals? Here’s our list of the best crypto brokers for review.
[ad_2]