[ad_1]
The difference between success and failure in Forex / CFD trading is highly likely to depend mostly upon which assets you choose to trade each week and in which direction, and not on the exact methods you might use to determine trade entries and exits.
So, when starting the week, it is a good idea to look at the big picture of what is developing in the market as a whole, and how such developments and affected by macro fundamentals, technical factors, and market sentiment. There are a few valid long-term trends in the market right now, which might be exploited profitably. Read on to get my weekly analysis below.
I wrote in my previous piece on 28th May that the best trade opportunities for the week were likely to be:
- Long of the NASDAQ 100 Index. The Index ended the week 1.62% higher.
- Long of the USD/JPY currency pair. This currency pair ended the week lower by 0.49%.
- Short of the NZD/USD currency pair following a daily close below $0.6000. This did not set up.
My forecast produced an overall win of 1.13%, averaging a gain of 0.38%.
Markets remain dominated by two ongoing debates in the USA – whether the Federal Reserve has really completed its cycle of rate hikes, and yesterday’s final resolution of the debt ceiling crisis as the Senate passed the deal. As opinion on these issues swing back and forth, the Dollar and stock markets swing up and down, with analysts scrutinizing every piece of US data for clues as to what the Fed will likely do at its next policy meeting in June.
The past week has seen the debt ceiling crisis completely resolved, which will probably produce a risk-on surge in the financial markets when they open for the week tomorrow. The NASDAQ 100 Index closed last week at a new 1-year high, while the boarder S&P 500 Index closed at a 9=month high.
The main issue now is the question of whether the Fed will hike rates by another 25bps at its next meeting in June. It looks increasingly likely that they will not, following last week’s stronger-than-expected US economic data, notably Friday’s NFP data which showed the US economy created more jobs than were expected last month, at 339k when only 193k were expected, following a strong print from JOLTS Job Openings data earlier in the week. On the other hand, the unemployment rate rose to 3.7% from 3.4% when a rate of 3.5% was expected.
The chance of a rate hike by the Fed in June is now priced at about 20%, down from 70% last week, but even if there is no hike then, it is widely expected that there will be one in July, so we likely have not reached the terminal rate yet.
Another key issue in the Forex market last week was the release of German Preliminary CPI data, which showed a month-on-month decline in inflation of 0.1% when a rise of 0.2% had been expected. This weakened the Euro somewhat as it lowered the prospect of ECB rate hikes. There was also a release of Australian inflation data, which showed that inflation there is running hotter than expected, but the underlying rate was expected.
Markets will now be focused on the US debt ceiling impasse and US non-farm payrolls data due at the end of the week.
Last week’s other key data releases were:
- US CB Consumer Confidence – this came in a little higher than expected, suggesting there is still a healthy level of spending.
- Canadian GDP – this was a little better than expected, with growth flat when a small decline was expected.
- US ISM Manufacturing PMI – this was almost exactly as expected.
The coming week in the markets is likely to see a lower level of volatility thank last week, as there are fewer scheduled high-impact releases this week than there were last week. This week’s key data releases are, in order of importance:
- Bank of Canada Overnight Rate and Rate Statement – no hike expected.
- RBA Cash Rate and Rate Statement – no hike expected.
- Australian GDP – expected to slow.
- Swiss CPI (inflation) is expected to rise to 0.3% month-on-month.
- US ISM Services PMI
- US Unemployment Claims
- Canadian Unemployment Rate
Monday will be a public holiday in New Zealand.
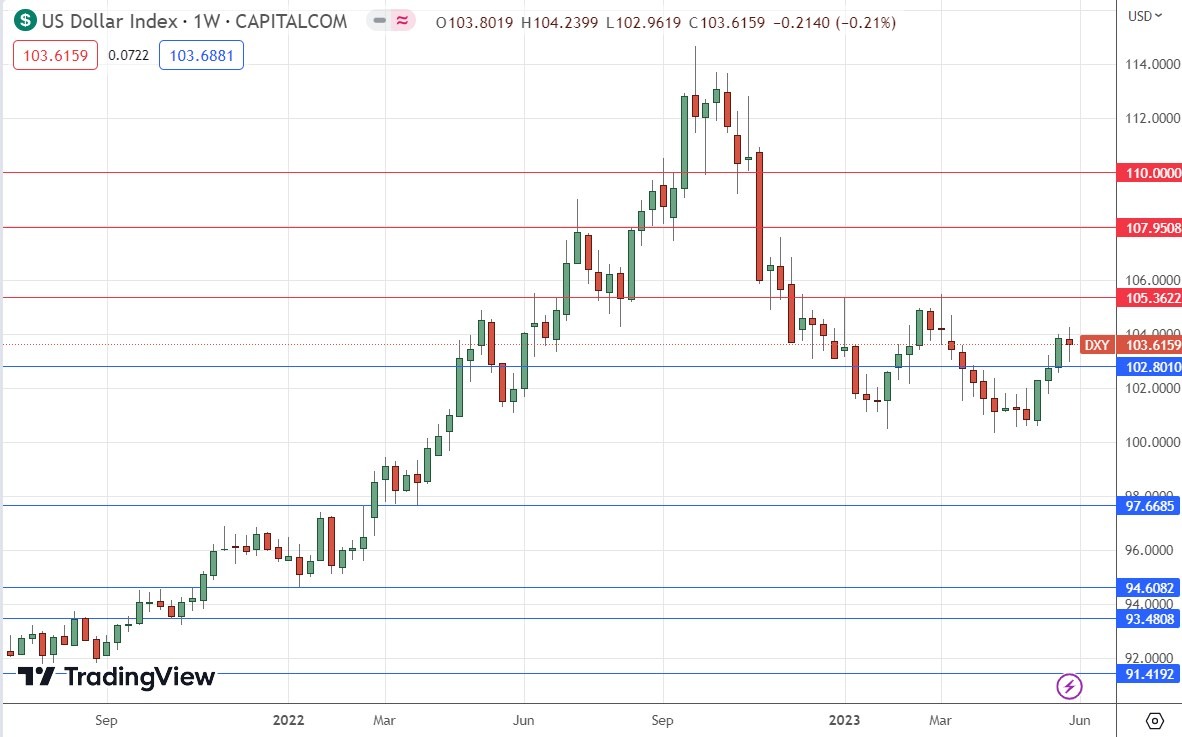
The weekly price chart below shows the U.S. Dollar Index made a small loss last week, in line with its long-term bearish trend, printing an indecisive candlestick that looks a bit like a doji.
The greenback remains within a technically valid long-term bearish trend, with its price a little lower than it was both 3 and 6 months ago.
I remain nervous to trade against the US Dollar over the coming week because it still looks quite strong, or at least more likely to consolidate than fall. However, we do see some relatively strong currencies, such as the Canadian and Australian Dollar, and the British Pound, which are showing some relatively strength against the greenback.

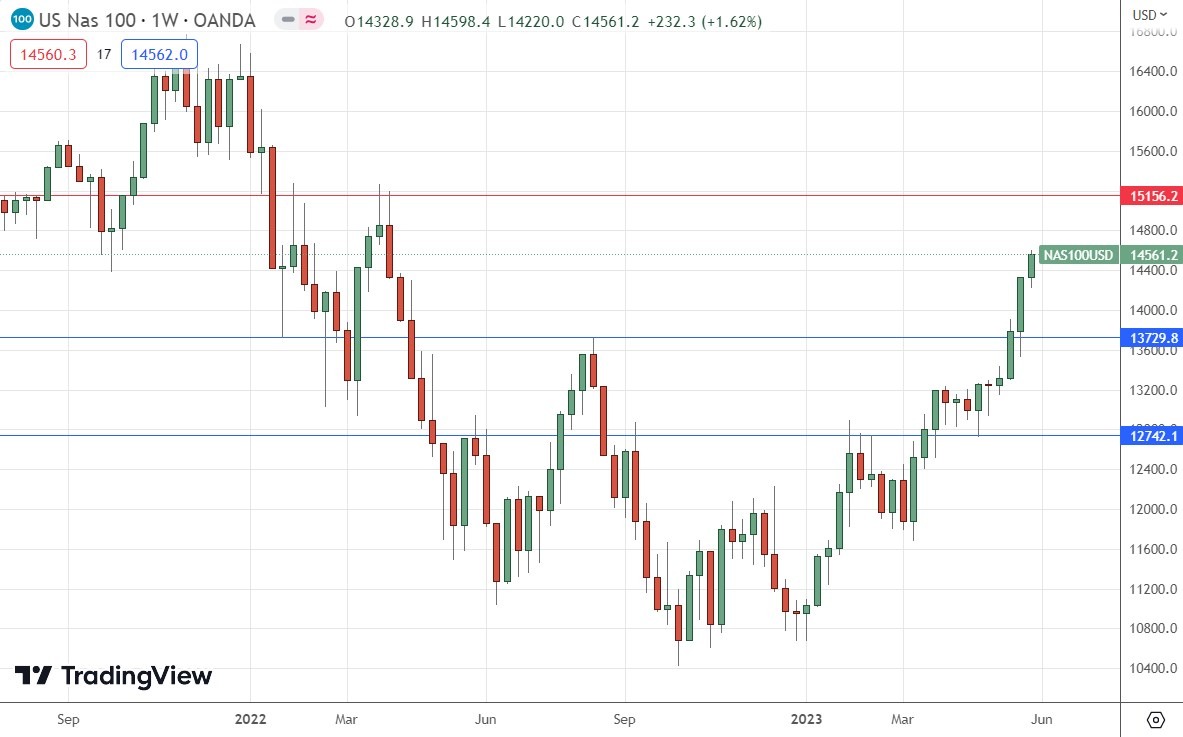
We saw another rise in the NASDAQ 100 Index over the past week, for the sixth consecutive week. The picture here is very bullish, for several reasons:
- The weekly candle closed firmly higher, at its highest closing price seen in over one year, for the third consecutive week.
- The weekly candlestick closed right on its high price, showing practically no upper wick.
- Stock markets are generally bullish, and the S&P 500 Index is also technically bullish, but less so, ending last week at a new 9-month high price.
There are no key resistance levels until the 15000 area, so the price has lots of room to rise.
The NASDAQ 100 Index still looks like a buy, but if it quickly retreats below 13730, bulls should be concerned.

The USD/JPY currency pair fell slightly last week, printing what is quite a bullish hammer candlestick which closed slightly lower.
We still see a valid long-term bullish trend, with the close two weeks ago being the highest weekly close seen in the last 6 months.
We see long-term weakness in the Japanese Yen, so as the Dollar continues to rise, this currency pair remains in focus. However, there are very early indications that the Bank of Japan is beginning to reverse this long-term weakness.
As a trend trader in major currency pairs, I am long of this currency pair and want to remain long unless we see a big drop. It is worth noting that volatility in the Yen is very high, so longer-term traders will need wide stop losses.
This currency pair looks like a buy if it retraces to a key support level and bounces firmly there, notably at ¥139.05.

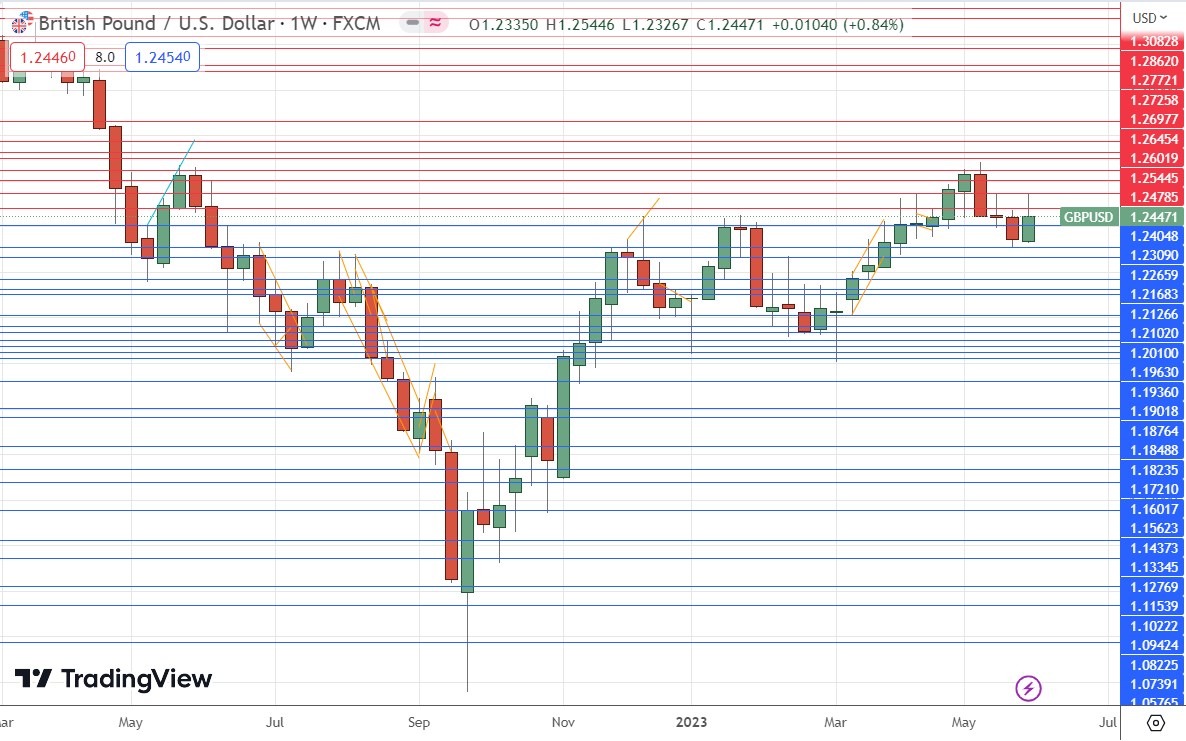
The GBP/USD currency pair printed a weak engulfing candlestick. The British Pound is showing some relative strength as the Euro, with which is it usually strongly positively correlated, weakens.
Despite the US Dollar’s questionable direction, the Pound is in a long-term bullish trend, although there is little momentum within this trend. However, if you are going to trade against the US Dollar, this is likely to be a good currency to use. As expectations lower of a June rate hike by the Fed, it is quite possible we will see the US Dollar move lower over the coming week, although price action does look indecisive or maybe even a bit bullish there.
This pair is usually good to trade on breakouts, so I would look to go long following a daily candlestick that closes above the big round number at $1.2500 near the high of its price range.

I see the best trading opportunities this week as:
- Long of the NASDAQ 100 Index.
- Long of the USD/JPY currency pair following a bounce at a key support level like ¥139.05.
- Long of the GBP/USD currency pair following a strong daily close above $1.2500.
Ready to trade our Forex weekly analysis? We’ve shortlisted the best Forex trading brokers in the industry for you.
[ad_2]
