[ad_1]
The GBP/USD pair also dropped as the debt ceiling issue continued.
- Sell the GBP/USD pair and set a take-profit at 1.2200.
- Add a take-profit at 1.2450.
- Timeline: 1-2 days.
- Set a buy-stop at 1.2420 and a take-profit at 1.2520.
- Add a stop-loss at 1.2350.
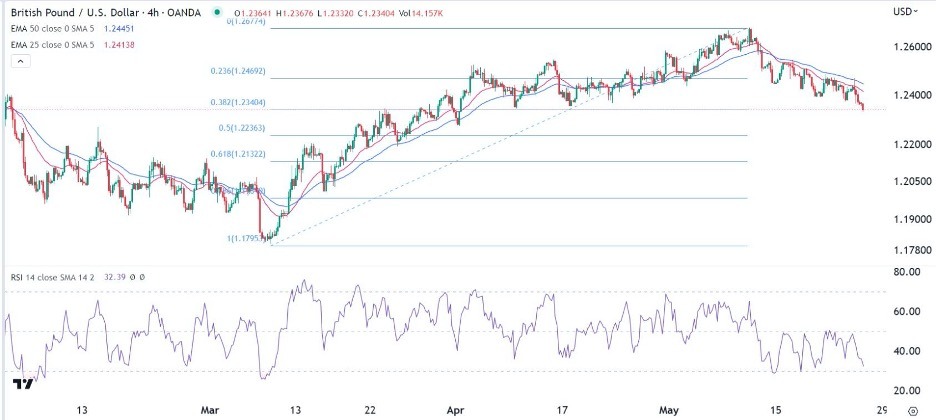
The GBP/USD exchange rate sell-off gained steam as it crashed to the lowest point since April 3rd. The pair plunged to a low of 1.2337, ~2.65% below the highest level this month. As it dropped, the DXY index surged to $104, the highest point since March 17.
The GBP/USD pair continued dropping after the latest UK consumer price index (CPI) data. According to the ONS, the headline CPI rose from 0.8% to 1.2% on a month-on-month basis. On a YoY basis, the CPI dropped from 10.1% to 8.7%.
Core inflation rose on a YoY and MoM basis. It jumped to 1.3% from March and by 6.8% from the same period in 2022. Therefore, these numbers mean that the country’s inflation is getting sticky. As a result, there is a likelihood that the Bank of England will continue hiking interest rates in the coming months.
The GBP/USD pair also dropped as the debt ceiling issue continued. After days of negotiations, Democrats and Republican negotiators are yet to reach an agreement on expanding the debt ceiling. As a result, rating agencies are focusing on the issue closely and there is a possibility of a rate cut. In a statement, Fitch decided to place the US in a rating watch negative area.
I believe that the two sides will ultimately reach an agreement, possibly during the weekend. If this happens, we will likely see a reversal of the dollar strength.
The GBP/USD pair also reacted mildly to the latest Fed minutes. The report showed that the committee was torn about the next actions. Some officials hope to continue hiking rates while others believe that pausing will be needed. Therefore, amid these issues, the latest US GDP numbers will likely have no major impact on the pair.
The GBP/USD pair has been in a strong downward trend in the past few days. On the 4H chart, it has moved to the 38.2% Fibonacci retracement level. The pair has also dropped below the 50-period moving average. At the same time, the Relative Strength Index (RSI) and other oscillators have drifted downwards.
Therefore, using trend-following principles, the pair will likely continue falling, with the next level to watch being at the psychological level of 1.2200. A reversal will happen when there are signs that the Democrats and Republicans are nearing a deal.

Ready to trade our free daily Forex trading signals? We’ve shortlisted the best UK forex broker in the industry for you.
[ad_2]