[ad_1]
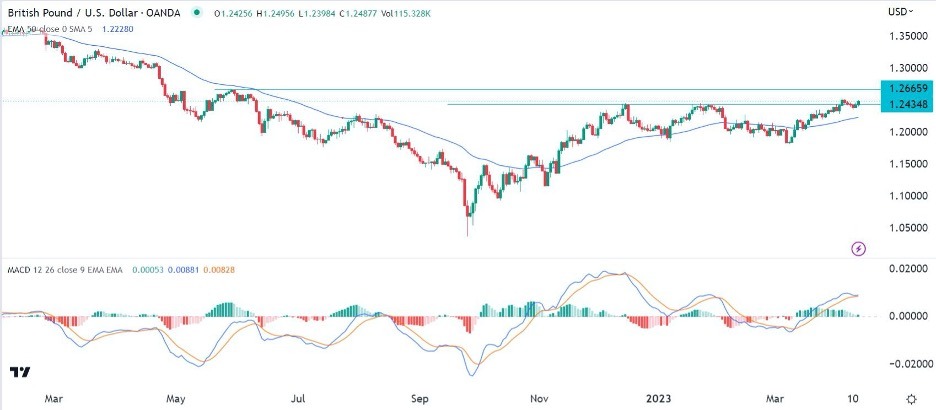
The daily chart shows that the GBP/USD pair has been in a strong bullish trend in the past few days.
- Buy the GBP/USD and set a take-profit at 1.2665.
- Add a stop-loss at 1.2350.
- Timeline: 1-2 days.
- Set a sell-stop at 1.2400 and a take-profit at 1.2300.
- Add a stop-loss at 1.2500.
The GBP/USD pair jumped above a key resistance level after the Fed minutes and the latest American consumer inflation data. It rose to a high of 1.2480, the highest level since June 2022. This means that the British pound has jumped by over 11% from last year’s low.
The GBP/USD pair rose after more signs pointed to a likely Fed pause in the coming meetings. Minutes published during the American session showed that some Fed officials supported pausing interest rate hikes in the March meeting. In it, the committee voted to increase rates by 25 basis points.
The Fed also deliberated on the state of the economy amid the rising risks in the banking sector. In March, several banks like Credit Suisse and Silicon Valley Bank collapsed. As a result, the bank warned that these collapses will likely hit the economy and move it to a mild recession.
Meanwhile, data from the United States showed that inflation was easing. The headline consumer price index dropped to 5.0%, the lowest level since 2021. Core inflation also dropped slightly on a month-on-month basis.
Therefore, a decline in inflation coupled with the rising risks of a recession mean that the Fed will start pivoting soon. Most analysts expect that the bank will hike rates by 0.25% in May and then take a strategic pause. There is also a possibility that the bank will cut rates either in Q4 or in 2024.
There will be no economic data from the UK on Thursday. As such, the focus will be in the United States, where the statistics agency will publish the latest producer price index (PPI) data. Economists expect that these inflation gauges continued dropping as well.
The daily chart shows that the GBP/USD pair has been in a strong bullish trend in the past few days. On Wednesday, the pair managed to move above the key resistance point at 1.2434, the highest point on January 24 and December 14. It has moved above the 50-day moving average while the MACD has continued rising.
Therefore, it seems like bulls have prevailed, which will see it rise to the next key resistance point at 1.2665, the highest point on May 30th. Failure to move above this level could see it retest the neckline of the triple-top pattern at 1.1814.

[ad_2]