[ad_1]
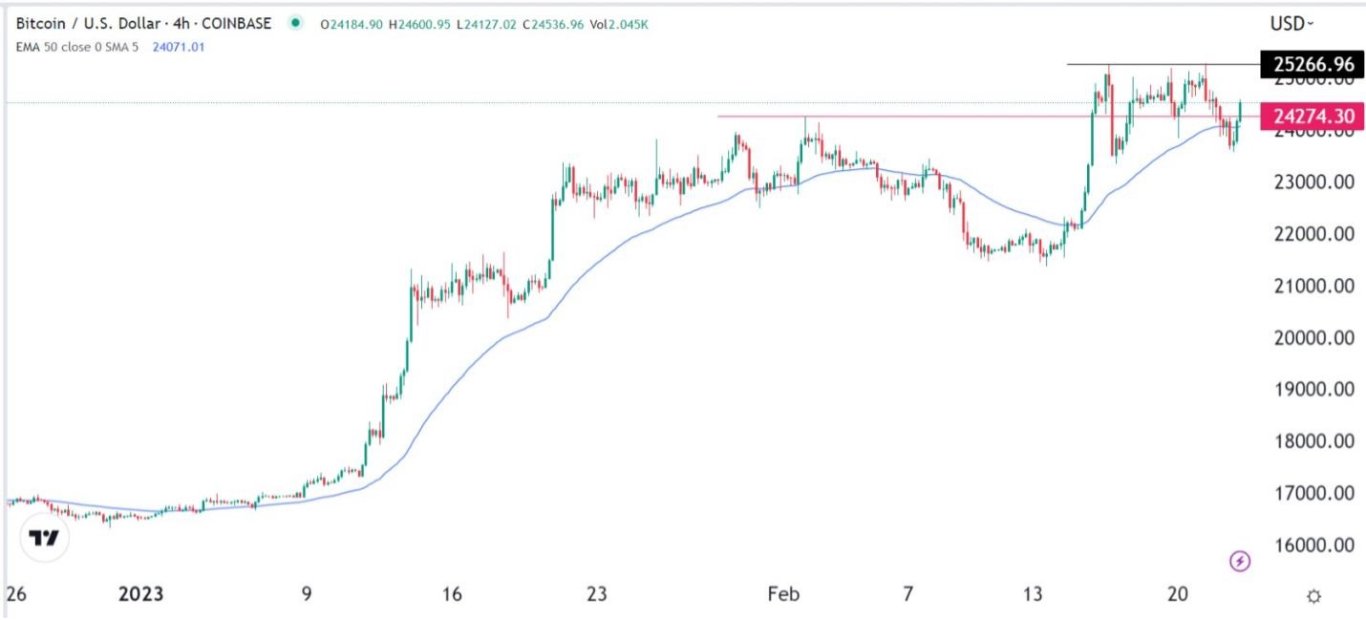
Bitcoin has also moved below the key support level at 24,600, the highest point on Feb 2. It has also crossed the important support at the 50-period moving average.
- Sell the BTC/USD pair and set a take-profit at 22,800.
- Add a stop-loss at 24,275.
- Timeline: 1 day.
- Set a buy-stop at 24,100 and a take-profit at 25,100.
- Add a stop-loss at 23,000.
Bitcoin has struggled to retest the year-to-date high of $25,266, which it tested on Sunday. The BTC/USD pair crashed below the support at $24,600 as investors started to reset their expectations about the Federal Reserve. It has retreated to a low of 23,520, the lowest point since last week.
Bitcoin retreated as investors started reassessing their expectations about the Fed and growth. In a note to investors, Mike Wilson, the head of equity strategy at Morgan Stanley, warned that the S&P 500 index could plunge by another 20%. This was a notable call because Wilson was voted as the best Wall Street analyst in 2022.
Other analysts from other institutions like Bank of America and Goldman Sachs have warned about the state of the market. The fears of a more hawkish Fed were confirmed on Wednesday when the Fed published minutes of the past meeting.
The S&P 500 outlook has an impact on the BTC/USD pair because of the close correlation that exists between the two assets.
These minutes confirmed initial fears that the committee was considering bigger rate hikes in the future. As such, with the recent strong economic numbers, there are signs that the Fed will not relent in hiking rates in the next three minutes.
According to Bloomberg, the average estimate among analysts is that the bank will hike in the next three meetings. The terminal rate will be about 5.35%. Therefore, some analysts have started moving away from risky assets like stocks and cryptocurrencies.
At the same time, global bonds have continued rising in the past few weeks. In the US, the 10-year yield retested the key resistance level at 4% last week. Similarly, the 30-year and the 2-year stand at 3.9% and 4.6%, respectively. This means that the yield curve has inverted, meaning that there are elevated recession risks.
My last BTC/USD prediction did not work out. In that piece, I argued that the coin was most likely to retest the year-to-date high and move to the resistance point at $26,000. Turning to the four-hour chart, the pair has formed what looks like a triple-top pattern at the highest point this week. The neckline of this pattern is at ~23,415.
Bitcoin has also moved below the key support level at 24,600, the highest point on Feb 2. It has also crossed the important support at the 50-period moving average. Therefore, the outlook of the pair is bearish, with the initial support being at 23,000.

[ad_2]