[ad_1]
Bitcoin, other cryptocurrencies, and stocks tend to do well in periods when the Fed is a bit dovish.
Bullish view
- Set a buy-stop at 23,436 and a take-profit at 24,000.
- Add a stop-loss at 22,500.
- Timeline: 1-2 days.
Bearish view
- Set a sell-stop at 23,100 and a take-profit at 22,000.
- Add a stop-loss at 24,000.
The BTC/USD price drifted upwards on Wednesday after the closely watched speech by Jerome Powell, the Federal Reserve chair. Bitcoin, along with American equities, rose to $23,385, the highest point since February 5.
Longer inflation fight
The Federal Reserve has been fighting inflation in the past few months as prices of both goods and services jumped. To do that, the bank has hiked rates by over 450 basis points and implemented quantitative tightening (QT). As a result, inflation has moved downwards from last year’s high of 9.1% to about 6.5%.
In a statement on Tuesday, Jerome Powell noted that the US was moving to a disinflationary phase as prices of most goods dropped. However, the main risk is that the tight labor market has pushed services inflation to a multi-year high. Therefore, the Fed is braced for a longer battle against inflation, which could see interest rates remain at an elevated level for longer.
Bitcoin, other cryptocurrencies, and stocks tend to do well in periods when the Fed is a bit dovish. This explains why prices dropped sharply in 2022 as the Fed and other global central banks like the European Central Bank (ECB) and Bank of England (BoE) embarked on a strong hiking cycle.
BTC/USD forecast (4H)
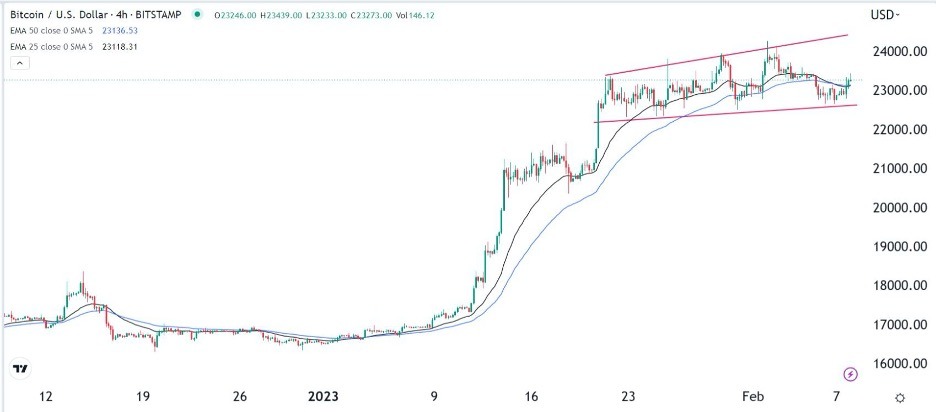
The BTC/USD pair has been in a downward trend following the strong American jobs numbers on Friday last week. It dropped from a high of 24,230 to a low of 22,695 on Tuesday. It then crawled back after Jerome Powell talked of disinflation in the US. The price has moved above the lower side of the rising channel.
Additionally, the pair managed to cross the 25-period and 50-period moving averages. Therefore, this chart points to more upside as buyers target the upper side of the channel at around 24,000. The stop-loss of this trade will be at 22,677, which is the lower side of the channel.

BTC/USD 1H chart analysis
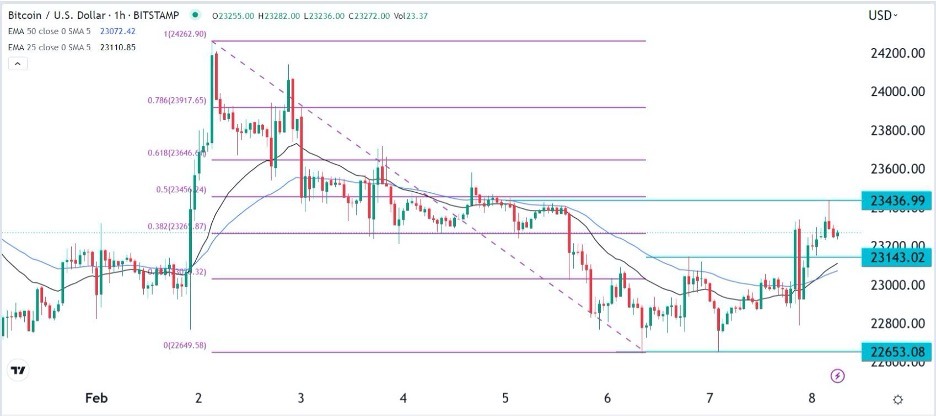
The hourly chart is a bit different from the previous one shown above. Bitcoin formed a double-bottom pattern at $22,653 whose neckline was at $23,143. It then rose and retested the crucial resistance at $23,436 (Feb 5 high) and the 50% retracement level. The pair has also moved above the 25-period moving average. Recently, it formed an inverted hammer pattern, which is a sign of a reversal.
Therefore, more upside will be determined if Bitcoin manages to move above the important resistance point at 23,436. Such a recovery could see it rise to the psychological level at 24,000.

[ad_2]