[ad_1]
The GBP/USD pair also formed a double-top at the 1.2453 level.
Bearish view
- Sell the GBP/USD pair and set a take-profit at 1.1850.
- Add a stop-loss at 1.2150.
- Timeline: 1-2 days.
Bullish view
- Set a buy-stop at 1.2050 and a take-profit at 1.2145.
- Add a stop-loss at 1.1860.
The GBP/USD price plunged to the lowest point since January 6 as the market continued reacting to the strong US jobs numbers. It fell to the psychologically important level of 1.2000, which was ~3.50% below the highest level in 2023.
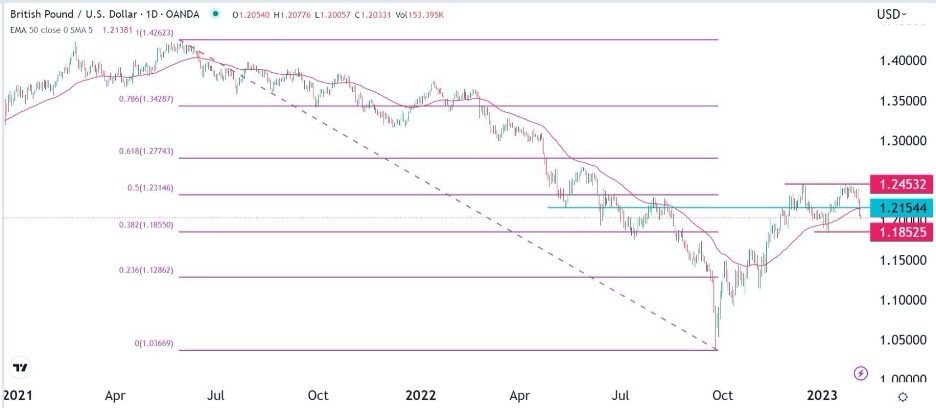
Double-top forms on the daily chart
On the 1D chart, we see that the recent sell-off started after the pair formed a double-top pattern at 1.2453. The neckline of the doubl-top was at 1.1852 (January 6 low). In technical analysis, the double-top pattern usually happens before a major sell-off happens. The ongoing sell-off was triggered by the strong US jobs numbers.
According to the Labor Department, the American economy added over 500k jobs in January as the unemployment rate moved to 3.4%, the lowest point in decades. As such, expectations are that the Fed could hike interest rates by 0.50% when it meets in March.
The pair moved below the 50% Fibonacci Retracement level at 1.2340. It also declined below the important support point at 1.2154 (May 16 low). Sterling also drifted below the 50% retracement level.
Therefore, the pair will likely continue falling as sellers target the neckline of the double-top pattern at 1.1852. This price is about 1.15% below the current level. A break below that neckline will bring the next psychological level of 1.1800 into view.

GBP to USD 4H analysis
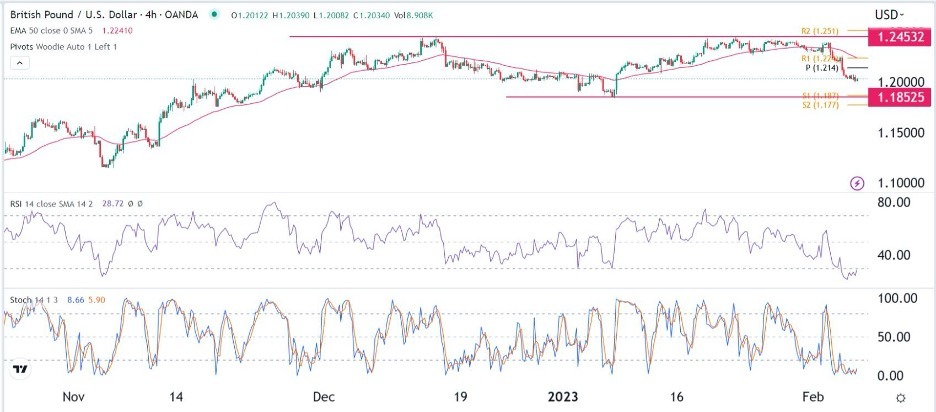
The GBP/USD pair also formed a double-top at the 1.2453 level. Starting from January 18, the pair also formed what looks like a triple-top pattern whose neckline was at 1.2262. The pair then continued moving downwards and pushed below the Woodie pivot point at 1.2140.
Like on the daily chart, the pair moved below the 25-day and 50-day moving averages. Similarly, the Relative Strength Index (RSI) and the Stochastic Oscillator have moved below the oversold level. Therefore, the overall outlook is that the pair will continue falling as sellers target the neckline of the double-top pattern at 1.1850.
However, because it is oversold, the GBP/USD pair will likely pull back and retest the Woodie pivot point at 1.2140. If this happens, the pair will resume the bearish trend.
There will be no major economic data on Tuesday. The only one to watch will be the Halifax house price index (HPI) data. Economists polled by Reuters expect that UK house prices dropped by 0.3% year-on-year in January. The impact of the data on the GBP to USD pair will be limited.

Ready to trade our Forex daily analysis and predictions? Here are the best Forex brokers in the UK to choose from.
[ad_2]