[ad_1]
Forex Brokers We Recommend in Your Region
See full brokers list
The difference between success and failure in Forex / CFD trading is highly likely to depend mostly upon which assets you choose to trade each week and in which direction, and not on the exact methods you might use to determine trade entries and exits.
So, when starting the week, it is a good idea to look at the big picture of what is developing in the market as a whole, and how such developments and affected by macro fundamentals, technical factors, and market sentiment.
Read on to get my weekly analysis below.
I wrote in my previous piece on 6th August that the best trade opportunities for the week were likely to be:
- Long of the NASDAQ 100 Index if we get a bullish bounce at any of the key support levels mentioned.
- Long of CC1! Cocoa Future following a daily close above 3562.
Neither of these trades is set up.
Market sentiment has continued to deteriorate, partly due to a feeling that previous market rallies are due a substantial correction, which seems to be ongoing. The fact that we are now into August when bullish appetites tend to become limited is also likely to be a factor.
There is little more to say about the market right now. It may well be that the rallies of recent months continue after this bearish retracement runs its course, although due to historical seasonality, this might not happen until September.
Last week’s major news in the Forex market was the US CPI (inflation) data which showed an annualized rate of 3.2%, which was widely expected. All the supplemental data also matched expectations, so everything here should have already been priced in.
Last week saw a continuing selloff of risky assets, especially technology stocks, with a stronger US Dollar acting as a safe haven. There is little likely to change this until Wednesday’s release of US FOMC Meeting Minutes, which might reveal some interesting information about the Fed’s rate deliberations.
Last week’s other key data releases were:
- US PPI – came in slightly above expectations at an increase of 0.3%, suggesting inflation might be a little hotter than the earlier CPI data indicated.
- Chinese CPI (inflation) – slightly better than expected, showing an annualized contraction of 0.3%.
- UK GDP – better than expected, with a monthly increase of 0.5% when only 0.2% was expected.
- US Prelim UoM Consumer Sentiment – met expectations.
- US Unemployment Claims – met expectations.
- New Zealand Inflation Expectations – met expectations.
The coming week in the markets is likely to see a lower level of volatility than last week, as there will be few US data releases. This week’s key data releases are, in order of importance:
- FOMC Meeting Minutes
- US Retail Sales
- UK CPI (inflation)
- RBA Monetary Policy Meeting Minutes
- RBNZ Official Cash Rate & Monetary Policy Statement
- Australian Wage Price Index
- Canadian CPI (inflation)
- Chinese Industrial Production
- US Empire State Manufacturing Index
- US Unemployment Claims
- UK Claimant Count Change
- Australian Unemployment Rate
It will be a public holiday in France and Italy on Tuesday.
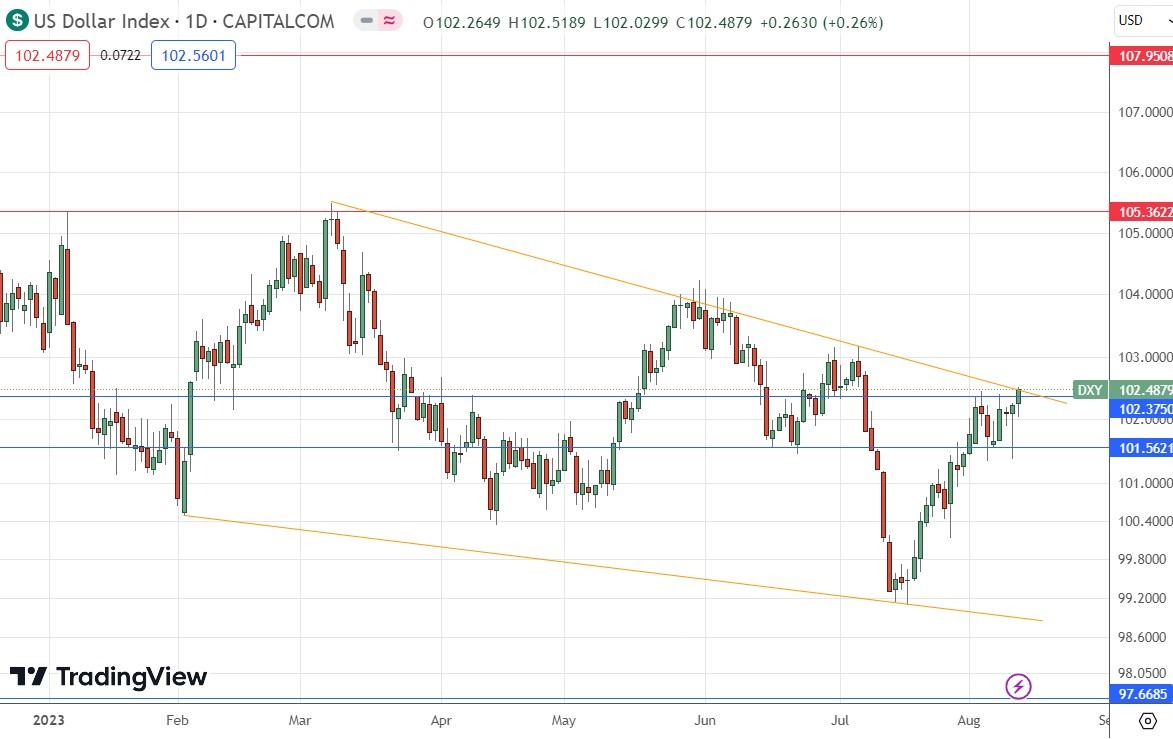
The daily price chart below shows the U.S. Dollar Index rose in value a last week continuing its short-term bullish trend. It is now on the verge of making a bullish breakout beyond the upper trend line of the long-term descending wedge pattern.
It is also significant that the price seems to be holding up above the former resistance level of 102.375.
Although the Dollar seems to be in a long-term bearish trend evidenced by the descending wedge pattern, it should be noted that there is no real long-term trend, as the price is above its level from 3 months ago but below its level of 6 months ago.
The recent price action is bullish.
I see the US Dollar as likely to make a technically important bullish breakout this week, which means it is probably a good idea to only look for long trades in the US Dollar this week.
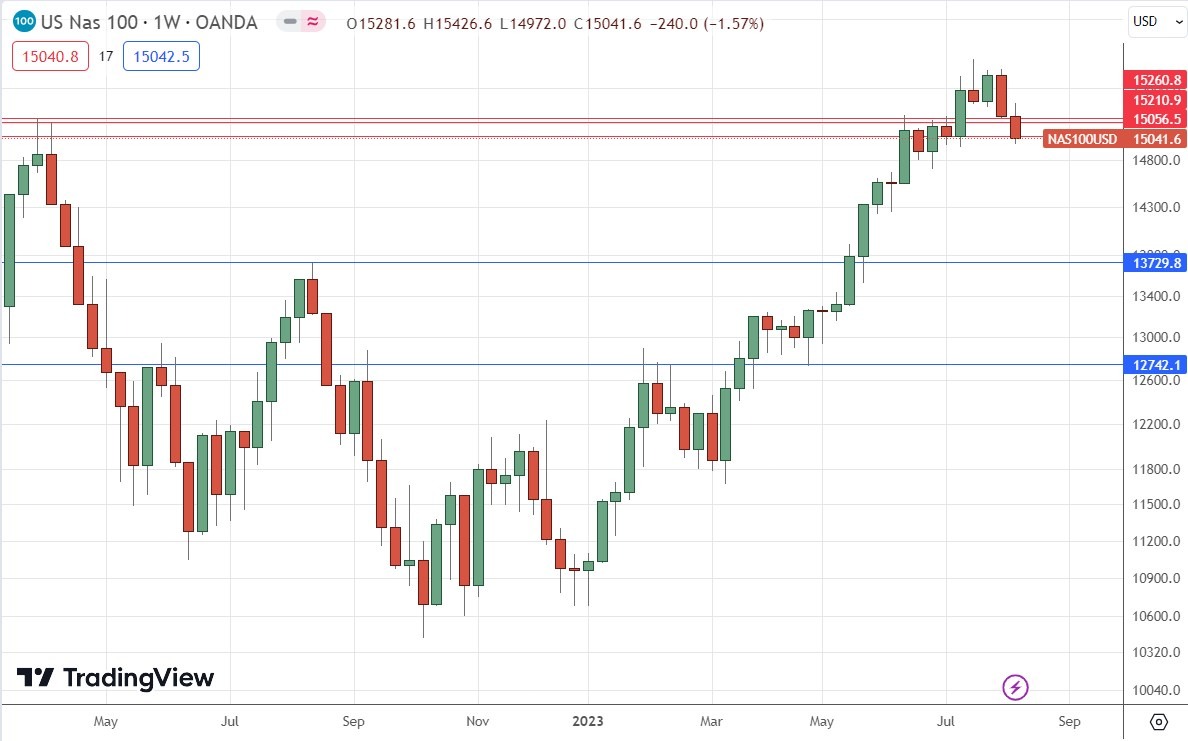
Last week saw a second consecutive firm decline in the price of the NASDAQ 100 Index after reaching a new 18-month high three weeks earlier. This week closed firmly lower, printing a bearish candlestick. The candle closed near the low of its range, which is a bearish sign.
Even more bearishly significant is the fact that the price easily cut through the three nearby support levels which I identified in my forecast last week. This suggests that we are due a further fall here over the coming week.
Markets are in a risk-off mood and some of the strongest selloffs we have seen are in technology stocks.
Despite the short-term bearish outlook, it is true that the price was only recently at a long-term high, so it cannot be ruled out that the price will turn bullish again. However, it is hard to see what scheduled data release will trigger such an improvement in sentiment.
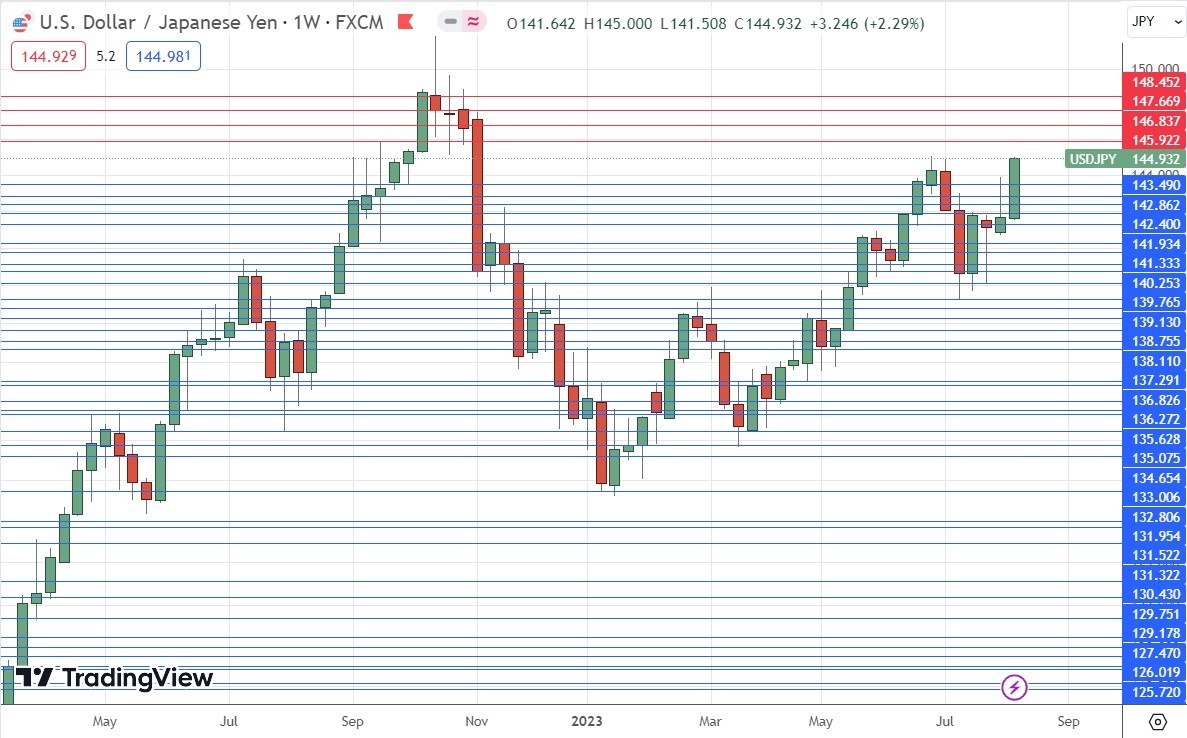
The USD/JPY currency pair printed an unusually large and strongly bullish candlestick, which closed right on its high, just a few pips below the 9-month high a little above the big round number at ¥145.
This currency pair will be getting a lot of attention right now as the weakening Yen is a dominant feature of the Forex market, while the Dollar looks as if it will very soon make a major bullish breakout.
However, bulls need to be aware that the price has made a bearish failure here just a few weeks ago, so the ¥145 could act as solid resistance.
Still, I think that this currency pair is a buy. More cautious traders might prefer to wait for a daily close above ¥145 or the long-term high at ¥145.07.
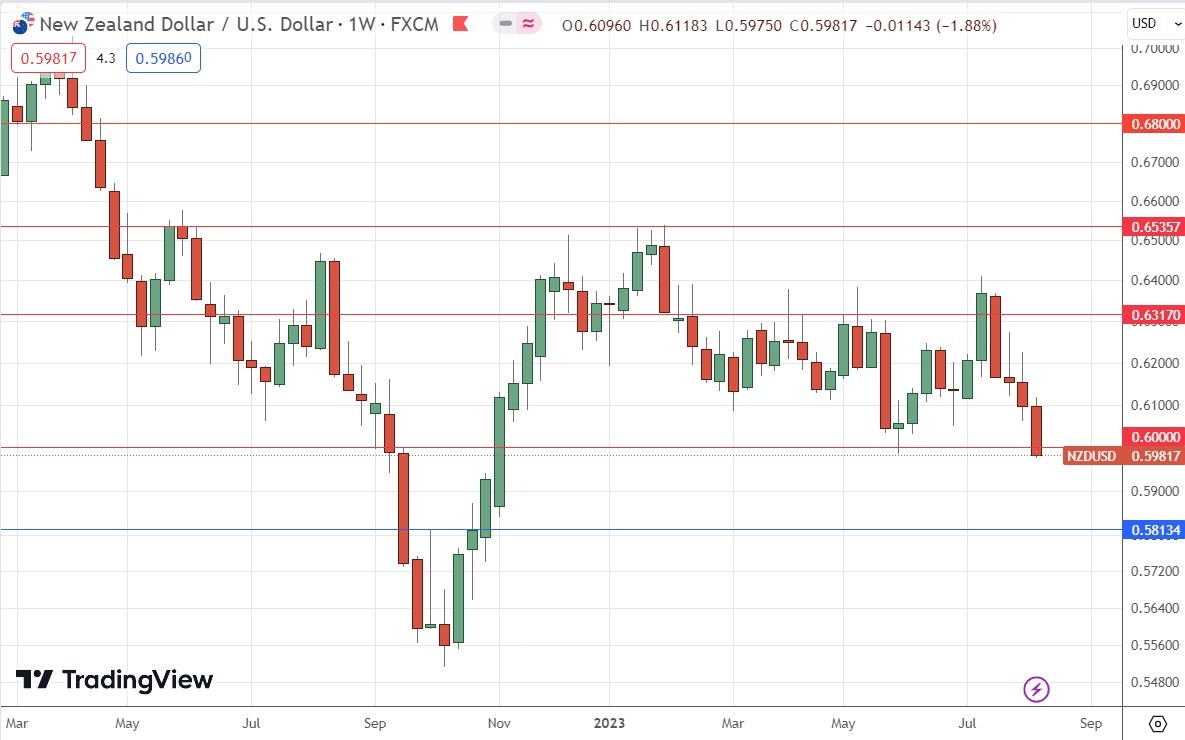
The NZD/USD currency pair printed a fairly large, strongly bullish candlestick, which closed right on its low at a new 9-month low. Notably, the price cut through the support level and major round number at $0.6000, ending the week below it.
This currency pair will be getting a lot of attention right now as the weakening Kiwi is a dominant feature of the Forex market, while the Dollar looks as if it will very soon make a major bullish breakout.
It is always important to be careful when trading this currency pair as it is prone to sudden reversals, but there could be good intraday short trade opportunities over the coming week if the price stays below $0.6000.
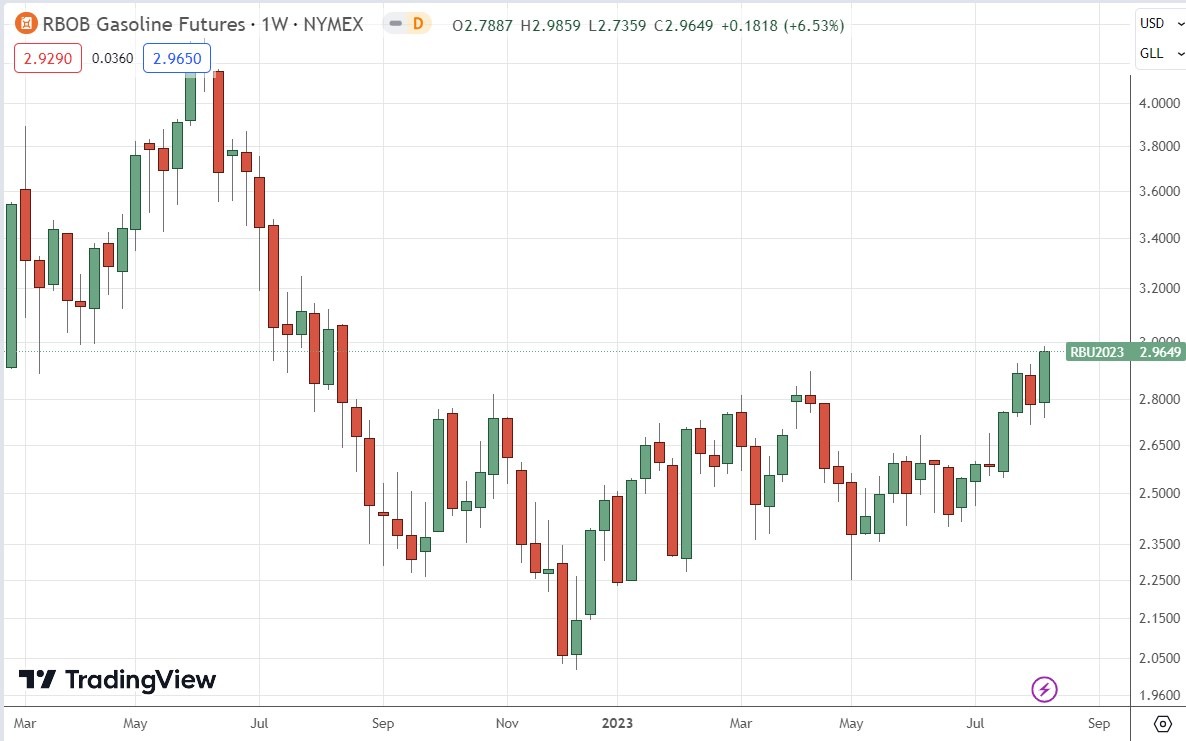
The price of Gasoline has been advancing since the 2023 began and is now up by about 30% this calendar year. Last Friday it made a bullish breakout from its range, closing at a new 1-year high price, which is a significant development. Gasoline futures are now trading in blue sky.
There is short-term bullish momentum, with the price ending the week close to the high of the week’s range, and Friday’s close was the highest close of any day of the week.
WTI Crude Oil is also somewhat bullish and has recently reached a new long-term high but is certainly less bullish than Gasoline. However, it is a good sign for bulls here that WTI Crude Oil has also been rising.
Trend trading commodities long when they make bullish breakouts to new long-term high prices has historically been a very profitable trading strategy.
I see the best trading opportunities this week as long as USD/JPY and Gasoline futures.
Ready to trade our weekly Forex forecast? Here are the best Forex brokers to choose from.
[ad_2]