[ad_1]
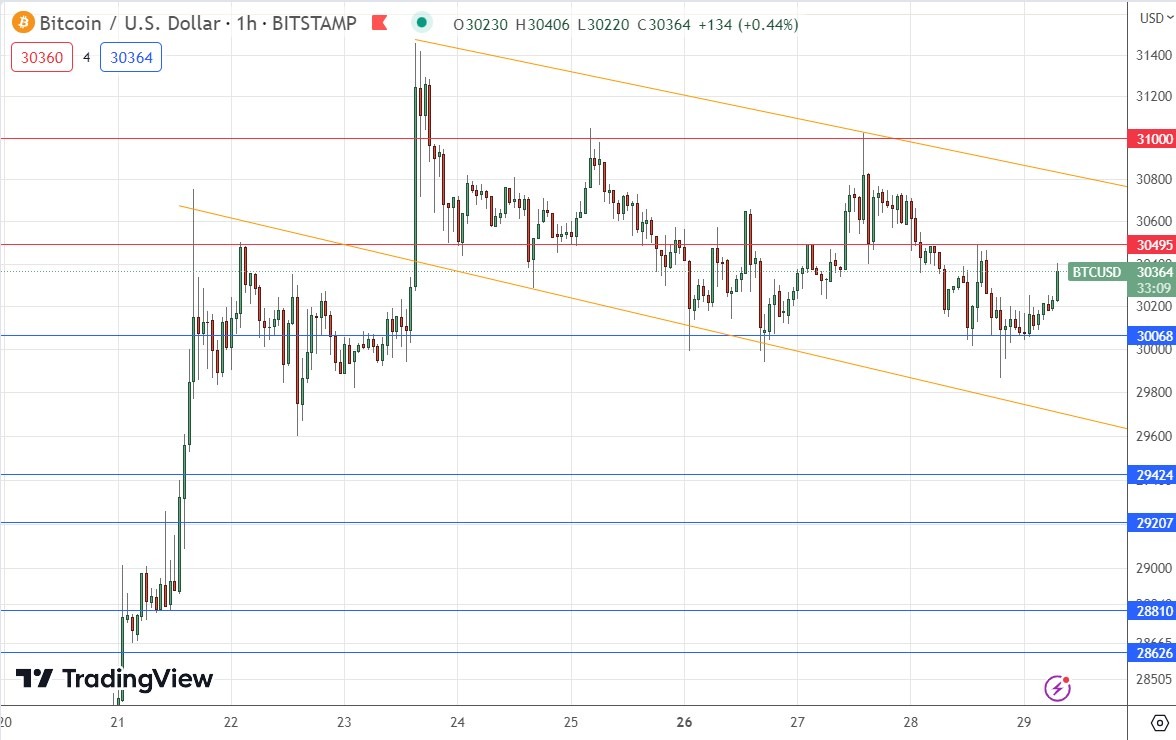
Strong support at $30k area.
Forex Brokers We Recommend in Your Region
See full brokers list
My previous BTC/USD signal on 14th June was not triggered as none of the key support or resistance levels were reached that day.
Risk 0.50% per trade.
Trades must be taken prior to 5pm Tokyo time Friday.
- Long entry after a bullish price action reversal on the H1 timeframe following the next touch of $30,068, $29,424, or $29,207.
- Place the stop loss $100 below the local swing low.
- Adjust the stop loss to break even once the trade is $100 in profit by price.
- Remove 50% of the position as profit when the trade is $100 in profit by price and leave the remainder of the position to run.
- Short entry after a bearish price action reversal on the H1 timeframe following the next touch of $30,405 or $31,000.
- Place the stop loss $100 above the local swing high.
- Adjust the stop loss to break even once the trade is $100 in profit by price.
- Remove 50% of the position as profit when the trade is $100 in profit by price and leave the remainder of the position to run.
The best method to identify a classic “price action reversal” is for an hourly candle to close, such as a pin bar, a doji, an outside or even just an engulfing candle with a higher close. You can exploit these levels or zones by watching the price action that occurs at the given levels.
I wrote in my previous BTC/USD analysis on 14th June that the price chart had become dominated technically by a triangle chart pattern which looked likely to see a breakdown, and this was also telegraphed by the dominant bearish price channel.
Therefore, I thought if we got two consecutive hourly closes later below the lower trend line of the triangle at about $25,600, we could expect the price will continue to move down to the next support level at $24,600.
This was a good call as we did get this breakdown, and the price did move lower after making two consecutive hourly closes below $25,600 that day, although it did not quite reach $24,600. However, a profitable short trade was there for the taking although its profit was a bit limited.
After reaching the lows that day, the price began to take off, driven higher and higher by the strong risk-on rally which we have seen in the markets during the last couple of weeks, which also lifted the Bitcoin price strongly.
After reaching the $30k area a few days ago, the price has failed to advance further and has made a bullish consolidation. There are a few interesting features – the bullish pennant formation (shown by the trend lines drawn within the price chart below), the strong support at $30,405 very confluent with the big round number at $30k, and the resistance level at the next round number handle above at $31k.
These could add up to either a long or short trading opportunity:
- Long if the price makes a bullish bounce off the $30k area with a fast rebound.
- Short if we get two consecutive hourly closes below $30k.

Concerning the US Dollar there will be a release of US Final GDP data and Unemployment Claims data at 1:30pm London time.
Ready to trade our daily Bitcoin signals? Here’s our list of the best Bitcoin brokers for review.
[ad_2]