[ad_1]
The difference between success and failure in Forex / CFD trading is highly likely to depend mostly upon which assets you choose to trade each week and in which direction, and not on the exact methods you might use to determine trade entries and exits.
So, when starting the week, it is a good idea to look at the big picture of what is developing in the market as a whole, and how such developments and affected by macro fundamentals, technical factors, and market sentiment. There are some long-term trends in the market right now, which might be exploited profitably.
Read on to get my weekly analysis below.
I wrote in my previous piece on 18th June that the best trade opportunities for the week were likely to be:
- Long of the NASDAQ 100 Index. The Index fell by 1.52% over the week.
- Long of the USD/JPY currency pair following a bounce at a key support level like ¥140.79. This pair rose firmly over the week, following a bullish bounce at the key support level at ¥141.21.
- Long of the GBP/USD currency pair. The currency pair fell by 0.80% over the week.
- Long of Cocoa futures. Cocoa futures fell by 0.24% by the end of the week.
My forecast produced an overall quantifiable loss of 2.56%, averaging a loss of 0.85% per highlighted asset.
When markets open for the week later, they are likely to be focused on the events in Russia over the past few days, which frankly seem quite mysterious, although the situation seems to have resolved itself into something like the previous status quo. Essentially, the Wagner group, a private army recruited mostly from prisoners which has been fighting for Russia in Ukraine, apparently more successfully than the Russian army, mutinied on Friday night and captured two key Russian towns before beginning to advance on Moscow, while its leader Prigozhin said he was seeking “justice”. Rivalry between the Wagner group and Russian army commanders is well established, with the Wagner group claiming they have been deliberately starved of supplies, which was probably true. Yesterday evening Prigozhin called off the march and left Russia for some kind of exile in Belarus, while Wagner members have been offered amnesty. Some Wagner members have joined the Russian army while others are returning to their positions on the front line in Ukraine.
Until the Wagner group called off their apparent mutiny, these developments were causing serious concern, as it looked as if Russia could plunge into a civil war, raising questions about the control of Russia’s nuclear weapons, and potentially interrupting exports of grain and oil, which would probably have caused high volatility in commodities markets. Stock markets could have been seriously spooked. For now, it seems likely that none of these things will happen, although that could change if the situation in Russia turns out not to have been resolved. This will also make analysts consider more seriously the prospect of a palace coup in Russia.
The other major focus right now will be Jerome Powell’s hawkish monetary testimony before Congress last week, which saw the US 2-Year treasury yield continue to move higher as analysts have now mostly been convinced that US interest rates have not reached a terminal level, and that rates will not be aggressively cut later this year. This is reinforced by recent data which showed that the US economy is performing relatively strongly despite all the recent rate rises, even though annualized inflation has fallen to the relatively low level of 4%. Powell’s hawkish rhetoric succeeded in cooling recent strong rises in US stock market indices.
Other items of note last week were the unexpectedly persistent inflation data in the UK, showing an annualized rate of a very high 8.7%, followed by the surprise rate hike by the Bank of England of 0.50% when only 0.25% had been widely expected, to a rate of 5%. The Swiss National bank raised its interest rate by 0.25%, which was also expected.
The outlook for the British economy now looks gloomier, which has knocked the British Pound despite the strong rate hike.
Last week’s other key data releases were:
- US Unemployment Claims – this came in almost exactly as expected.
- Flash Manufacturing Services & PMI in the USA, UK, Germany, and France – these data were largely worse than expected, except for USA services, adding credibility to the idea that the US economy is outperforming the UK and the major parts of the Eurozone.
The coming week in the markets is likely to see a similar level of volatility to last week, as although there will be no central bank policy meetings, we will see several important inflation and GDP data points. This week’s key data releases are, in order of importance:
- US Final GDP
- US Core PCE Price Index
- German Preliminary GDP
- Canadian CPI (inflation)
- Canadian GDP
- Australian CPI (inflation)
- US CB Consumer Confidence
- ECB Forum Central Bank Discussion
Thursday will be a public holiday in Italy.
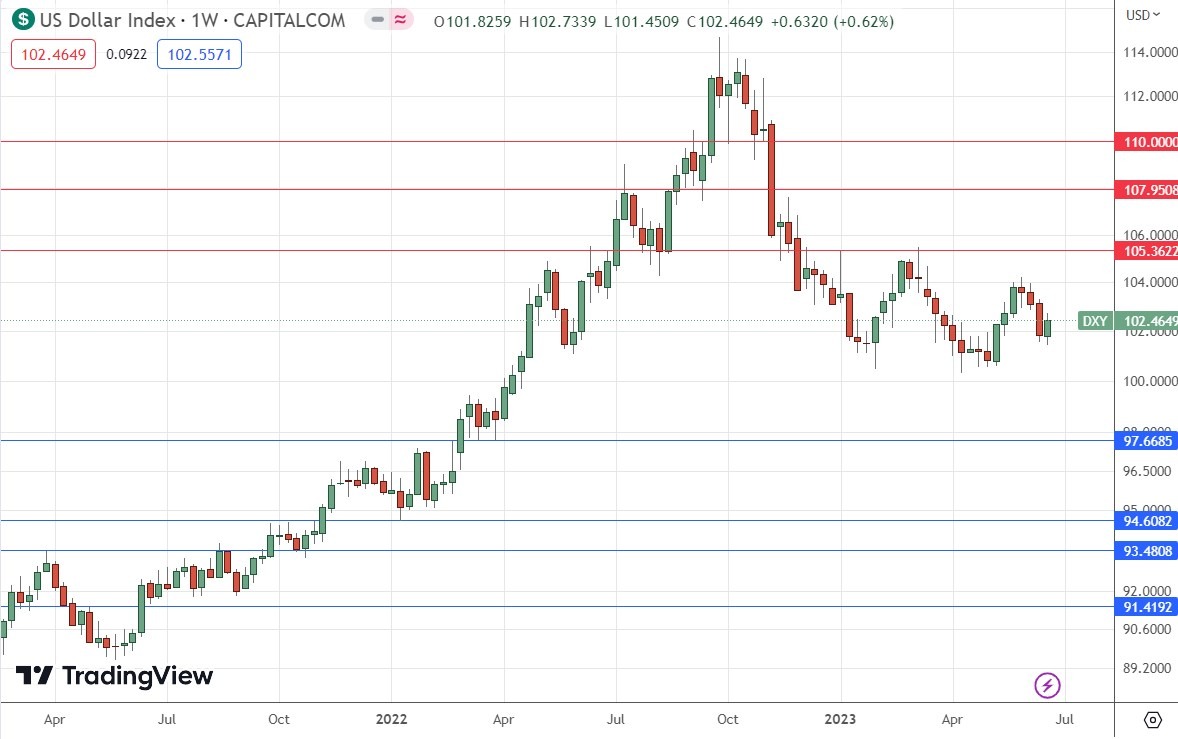
The weekly price chart below shows the U.S. Dollar Index printed a small bullish candlestick last week, against its long-term bearish trend.
The Dollar remains within a technically valid long-term bearish trend, with its price a little lower than it was both 3 and 6 months ago. However, the US Dollar is in a consolidation pattern, technically, which tends to make the Forex market quite dull.
Although Fed Chair Jerome Powell effectively talked up the Dollar last week by emphasizing that more rate increases will be likely during 2023, it is not clear that this is going to put the greenback into a meaningful bullish trend.
I think it will make the most sense to focus on opportunities in other currencies over the coming week instead of the US Dollar, such as the weak Japanese Yen.
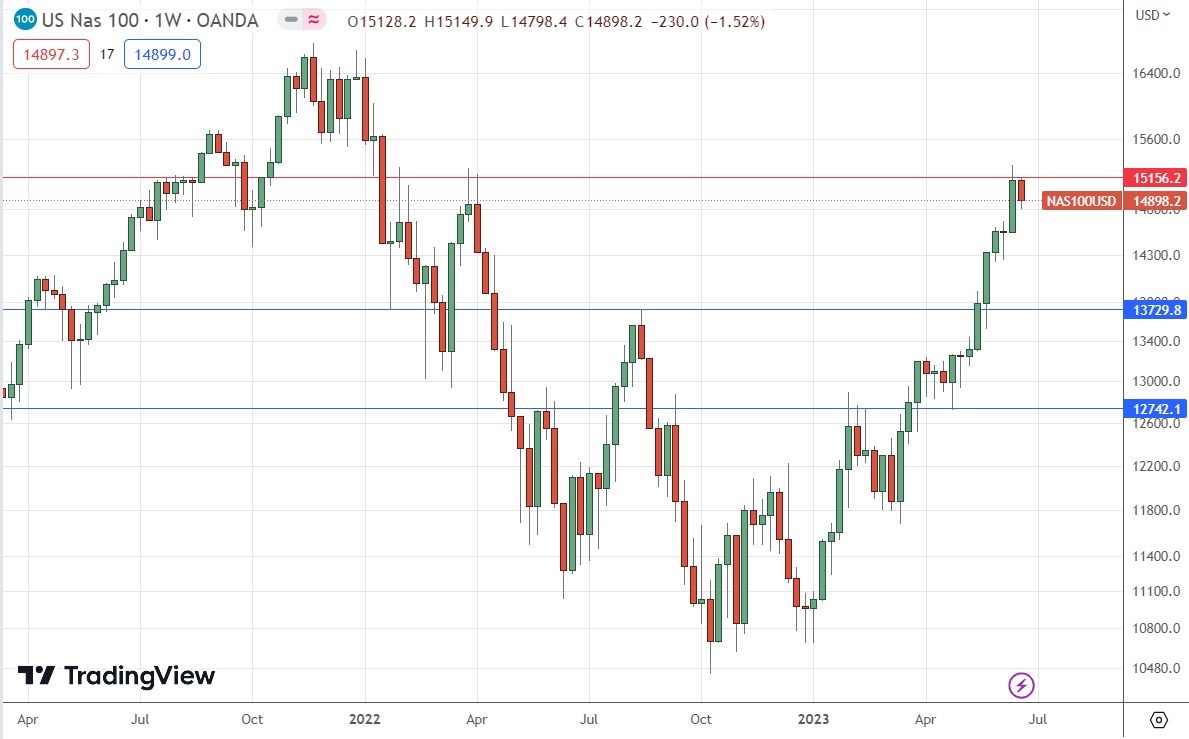
After eight consecutive weeks of gains, we finally saw a fall in the NASDAQ 100 Index over the past week, after the price rejected the resistance level which I had identified at 15156.2 as shown within the below price chart. The fall was assisted by Fed Chair Powell’s hawkish talk. Although the long-term picture looks very bullish, with the market running away to the upside and having already risen by about 40% this calendar year before the year is even halfway over, we may be due a correction or a consolidation.
I am also aware of summer seasonality which tends to see stock markets drift or decline.
This could be a good time to be cautious and stand aside. However, I will see this Index as a buy if we get a firm daily close above the resistance level at 15156.2 later this week.
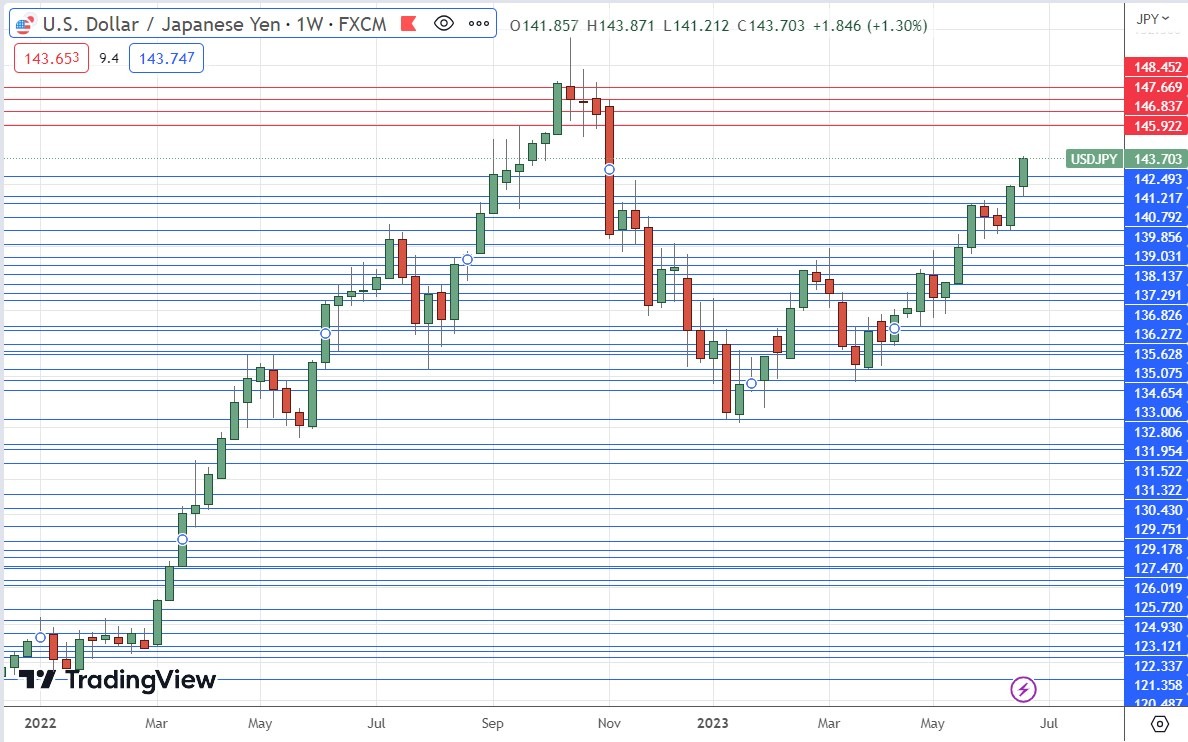
The USD/JPY currency pair again rose firmly last week to make its highest weekly close in 7 months, ending the week right on its high. These are bullish signs.
However, the US Dollar overall cannot be said to be in a long-term bullish trend, so there is some conflict here. The upwards movement is due to the very weak Japanese Yen.
The Bank of Japan stuck to its ultra-loose monetary policy at its policy meeting the week before last.
As a trend trader in major currency pairs, I am long of this currency pair and want to remain long. The case for this long trade is getting stronger following Fed Chair Jerome Powell’s hawkish rhetoric on rate hikes and inflation last week.
This currency pair looks like a buy.
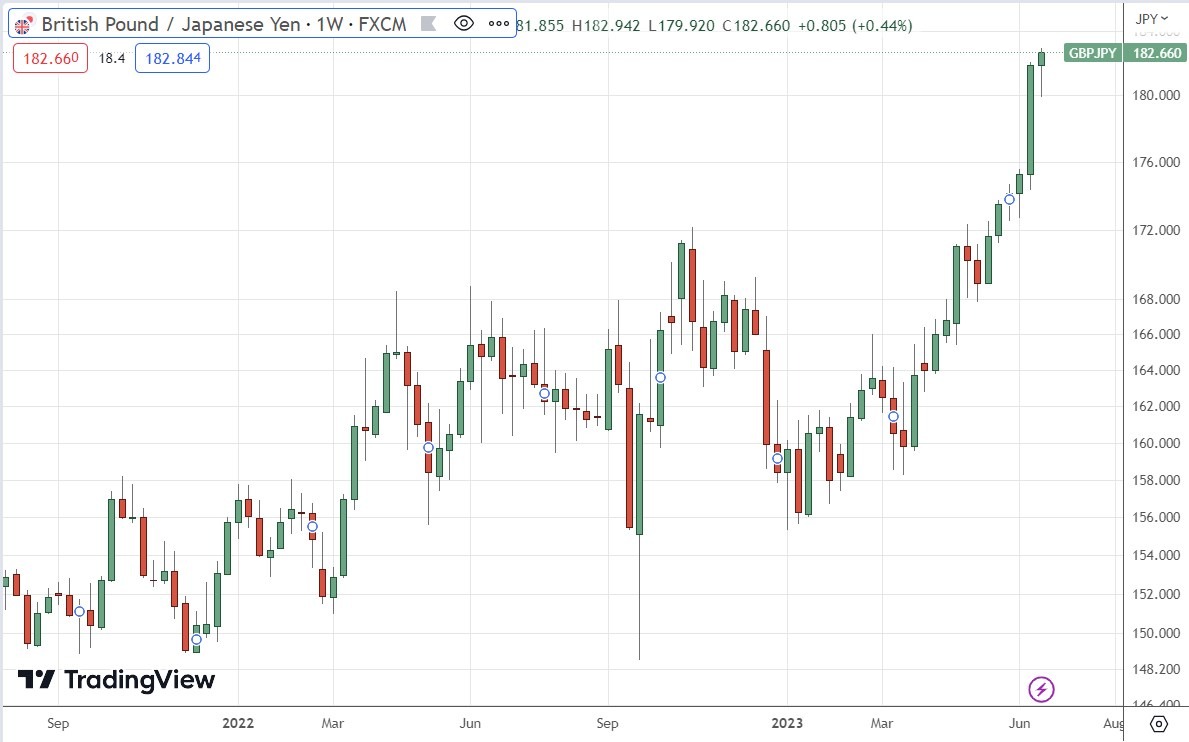
The GBP/JPY currency cross rose strongly last week to reach another 7-year high price.
Before trend traders get overly excited, it is important to keep in mind that this says much more about the weak Japanese Yen than about the British Pound.
The British Pound has been strong and looked like it would break to new highs last week against the US Dollar in the GBP/USD currency pair, but the surprisingly strong inflation data followed the shock 0.50% rate hike from the Bank of England, which did not boost the Pound like it could have been expected to, puts the future of the Pound in question.
However, the Pound is still within a long-term bullish trend, so it could rise further here. If you want to bet on Yen weakness over the medium to long-term, it could be an idea to use a mix of stronger currencies, which could include the British Pound. It might be wise to wait and see how the British Pound reacts first over the next few days.
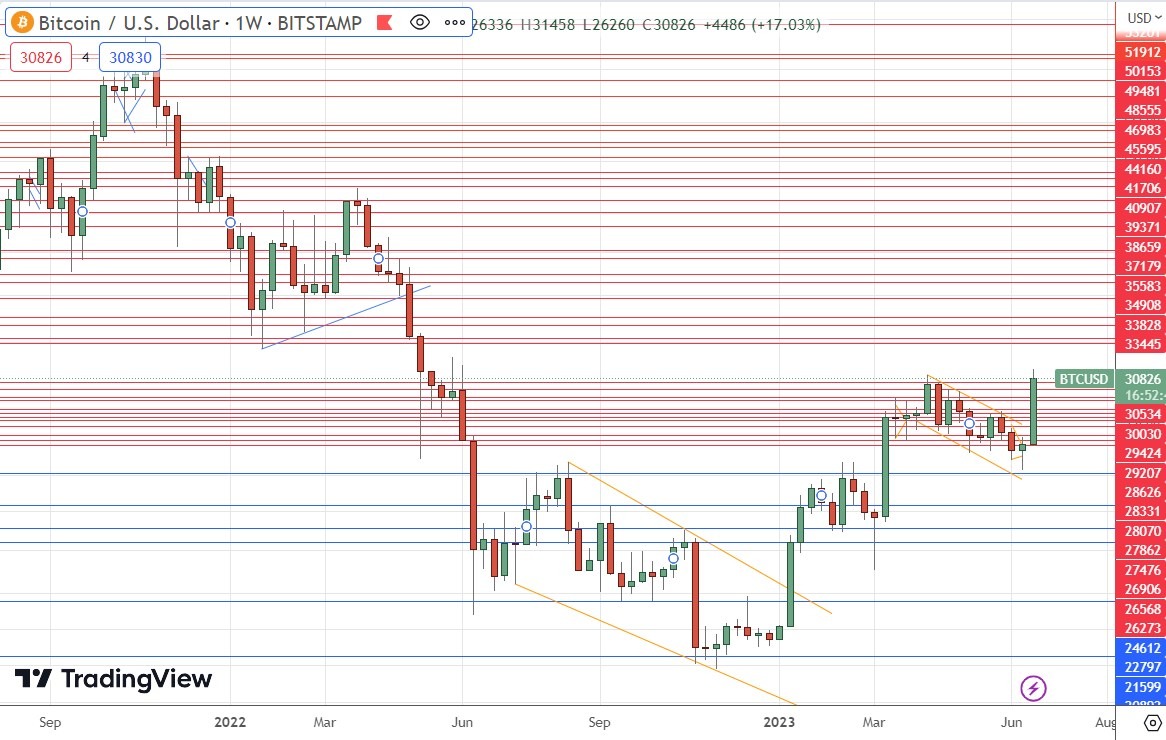
Bitcoin made a strong bullish breakout over the past week and may be finally overcoming the area of strong resistance around the big round number at $30k which had held firm for a long time. The price of Bitcoin has reached a new 1-year high.
The main reason for this strong rise seems to be the fact that several major issuers have filed to open Bitcoin ETFs, which the US regulatory authorities have indicated they will refuse in the past. This recent activity suggests that these major finance houses see a strong chance that the regulators will now say yes.
The existence of Bitcoin ETFs will make this cryptocurrency much more accessible to retail traders and investors, who until now must either buy Bitcoin directly and worry about storing it, or use futures or other derivatives, which they may not qualify for.
Cautious traders may want to wait for the ETF approval before buying, but this could mean missing much of the initial move that would likely result. Another approach could be to buy Bitcoin following a daily close above $31k.
I see the best trading opportunities this week as:
- Long of the USD/JPY currency pair.
- Long of Bitcoin after a daily close above $31k.
- Long of the NASDAQ 100 Index after a daily close above 15156.2.
Ready to trade our Forex weekly forecast? Here’s a list of some of the best Forex trading platforms to check out.
[ad_2]