[ad_1]
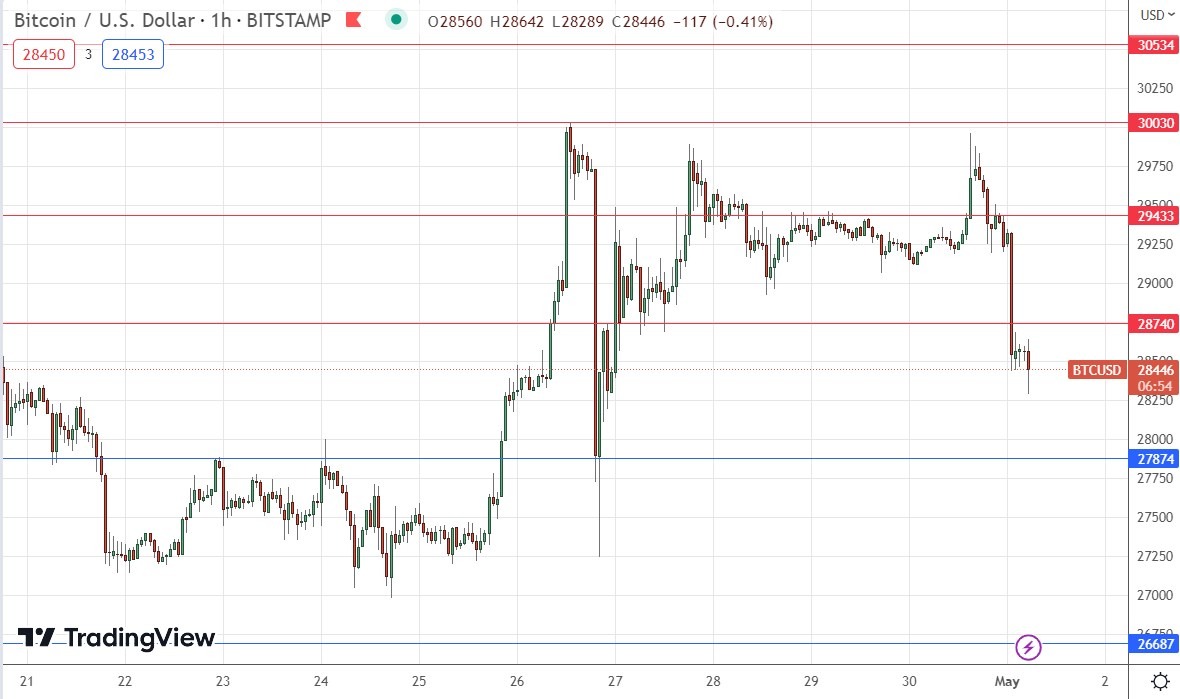
The breakdown below $28.740 is a bearish sign.
My previous BTC/USD signal on 27th April produced a profitable long trade from the bullish rejection of the support level which I had identified at $28,740 by an inside bar on the hourly chart.
Risk 0.50% per trade.
Trades may only be entered before 5pm Tokyo time Tuesday.
- Go long after a bullish price action reversal on the H1 timeframe following the next touch of $27,874 or $26,687.
- Put the stop loss $100 below the local swing low.
- Move the stop loss to break even once the trade is $100 in profit by price.
- Take off 50% of the position as profit when the trade is $100 in profit by price and leave the remainder of the position to ride.
- Go short after a bearish price action reversal on the H1 timeframe following the next touch of $28,740, $29,433, $30,030, or $30,534.
- Put the stop loss $100 above the local swing high.
- Move the stop loss to break even once the trade is $100 in profit by price.
- Take off 50% of the position as profit when the trade is $100 in profit by price and leave the remainder of the position to ride.
The best method to identify a classic “price action reversal” is for an hourly candle to close, such as a pin bar, a doji, an outside or even just an engulfing candle with a higher close. You can exploit these levels or zones by watching the price action that occurs at the given levels.
I wrote in my previous BTC/USD analysis last Thursday that another bullish test of $30,030 was not out of the question.
I thought that a long trade from $28,740 while being quick to take profits especially at the first resistance level, could be the best trade to set up today.
Another bearish rejection of $30,030 could be a very attractive signal for a short trade entry.
This was an excellent call as it was correct in identifying both the best long trade for the day, and the best short trade later from the bearish rejection of $30,030.
The technical picture is now considerably more bearish as we are seeing a double top chart pattern completed by the second rejection of the resistance level at $30,030.
An even more bearish sign was printed in the last few hours as the price, after falling quite hard, broke down decisively below the new resistance level at $28,740.
The US Dollar is making a minor comeback today, against its long-term trend, and as long as that continues, Bitcoin should continue falling.
I therefore see the best potential trade which might set up today as a short trade from a rest of $28,740 which results in a strong bearish rejection.
Bears should be cautious and expect to take any profits from such a short trade quickly, as the support is likely to begin to be felt as close as $28,000 even before $27,874 would be reached.

Concerning the US Dollar, there will be a release of ISM Manufacturing PMI data at 3pm London time.
Ready to trade our daily Bitcoin signals? Here’s our list of regulated cryptocurrency brokers for your review.
[ad_2]
