[ad_1]
There will be no major economic data from the UK this week.
- Buy the GBP/USD pair and set a take-profit at 1.2550.
- Add a stop-loss at 1.2380.
- Timeline: 1-2 days.
- Set a sell-stop at 1.2400 and a take-profit at 1.2300.
- Add a stop-loss at 1.2500.
The UK economy is going through a rough patch as inflation remains stubbornly high. Despite the rising recession odds, the GBP/USD pair has done relatively well in the past few months as it jumped by more than 5% from the lowest point in March and 20% from last year’s low.
Economic data published last week showed that the UK economy is not doing well. While the jobs data published on Tuesday were strong, other numbers revealed that the economy was struggling. For example, on Wednesday, data revealed that the headline and core consumer inflation remained at an elevated level in March.
The headline and core CPI remained above 10% in March, making it one of the highest level in Europe. Food and energy prices remained at an elevated level during the month. As a result, it seems like soaring inflation has pushed more people to go back to work as the labor participation continued rising.
At the same time, high inflation is having an impact on the country’s retail sector. On Friday, data showed that retail sales dropped in March. Core sales have now dropped for several consecutive months. Department and retail sales were among the worst performers.
Therefore, it is evident that the UK economy is going through a stagflation period. Stagflation is defined as a period when slow economic growth coincides with a period of high inflation.
There will be no major economic data from the UK this week. Therefore, the focus will be on the upcoming corporate earnings from the US and select economic data from the US. The Conference Board will publish the next consumer confidence data on Tuesday. These numbers will be followed by the next new home sales, durable goods orders, and US GDP data.
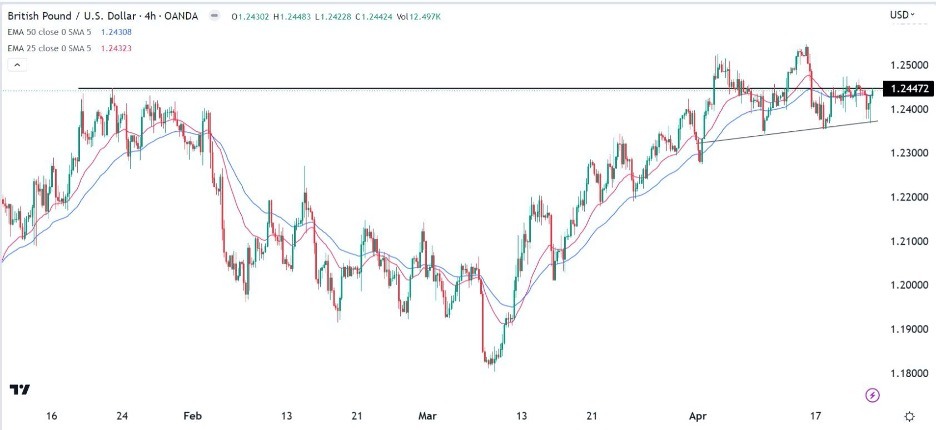
The GBP/USD chart shows that the pair has been in a tight range in the past few days. It has moved slightly above the 25-period moving average. Further, the pair has moved slightly below the key resistance point at 1.2450, the highest point on January 23rd. It has moved above the ascending trendline that is shown in black.
Therefore, the pair will likely have a bullish breakout as buyers target the key resistance point at 1.2545, the highest point on April 14. The stop-loss of this trade is at 1.2380.

[ad_2]