[ad_1]
The difference between success and failure in Forex / CFD trading is highly likely to depend mostly upon which assets you choose to trade each week and in which direction, and not on the exact methods you might use to determine trade entries and exits.
So, when starting the week, it is a good idea to look at the big picture of what is developing in the market as a whole, and how such developments and affected by macro fundamentals, technical factors, and market sentiment. There are several valid long-term trends in the market right now, which might be exploited profitably. Read on to get my weekly analysis below.
I wrote in my previous piece on 9th April that the best trade opportunities for the week were likely to be:
- Long Bitcoin against the USD following a daily close above $30,000. On Tuesday the price closed at $30,246 and it ended Friday at $30,498, a profit of 0.83%.
- Long of the GBP/USD currency pair following a daily close above $1.2500. On Thursday it closed at $1.2523, and it ended Friday at $1.2412, a loss of 0.89%.
- Long of the NASDAQ 100 Index. The Index rose by 0.21% over the week.
- Long of Gold following a bullish rejection of $2000, $1950, or $1917. This did not set up.
- Long of Silver following a convincing bullish breakout beyond $25. On Tuesday Silver closed at $25.05 and ended the week higher by 1.32%.
My forecast produced an overall profit of 1.47%, averaging 0.37%.
News about global financial markets is dominated by last week’s US economic data releases which have affected the outlook for the future of the US economy and interest rates.
Analysts see evidence that the US economy is cooling faster than expected, with the closely watched US CPI data showing a strong fall in its annualized rate from 6.0% to 5.0%, slightly lower than the 5.1% which had been expected, although Core CPI came in a little higher. This was reinforced later in the week by considerably lower than expected Retail Sales and PPI data, suggesting that the American consumer is beginning to feel the pinch. Unemployment claims also came in slightly higher than expected, completing the mildly deflationary picture. However, the US 2-Year Treasury Yield rose over the week, which contradicts this picture, but it seems the yield has seen so much speculative volatility lately that it is arguably not a worthwhile barometer right now. The major US stock market indices all closed slightly higher over the week.
Last week’s other key data releases were:
- US FOMC Meeting Minutes – this was somewhat out of date but was notable for members still expressing concern over the recent banking crisis following the failures of two important US banks.
- Bank of Canada’s Overnight Rate, Rate Statement, and Monetary Policy Report – the Bank of Canada left rates unchanged as had been expected.
- UK GDP data – this showed no growth month-on-month, although 0.1% growth had been expected.
- Preliminary UoM Consumer Sentiment – this came in a little higher than expected, contradicting retail sales data which was very poor.
- Australian Unemployment data – job creation was stronger this month, with the unemployment rate unexpectedly falling from 3.6% to 3.5%.
The coming week in the markets is likely to see a lower or similar level of volatility compared to last week, due to a considerably lower intensity of key data releases scheduled. This week’s key data releases are, in order of importance:
- UK CPI (inflation)
- Canadian CPI (inflation)
- US Unemployment Claims
- Flash Services & Manufacturing PMI for USA, Germany, France, and UK
- US Empire State Manufacturing Index
- New Zealand CPI (inflation)
- Governor of Bank of Canada Testifies Before Parliament
- UK Claiming Count Change (unemployment)
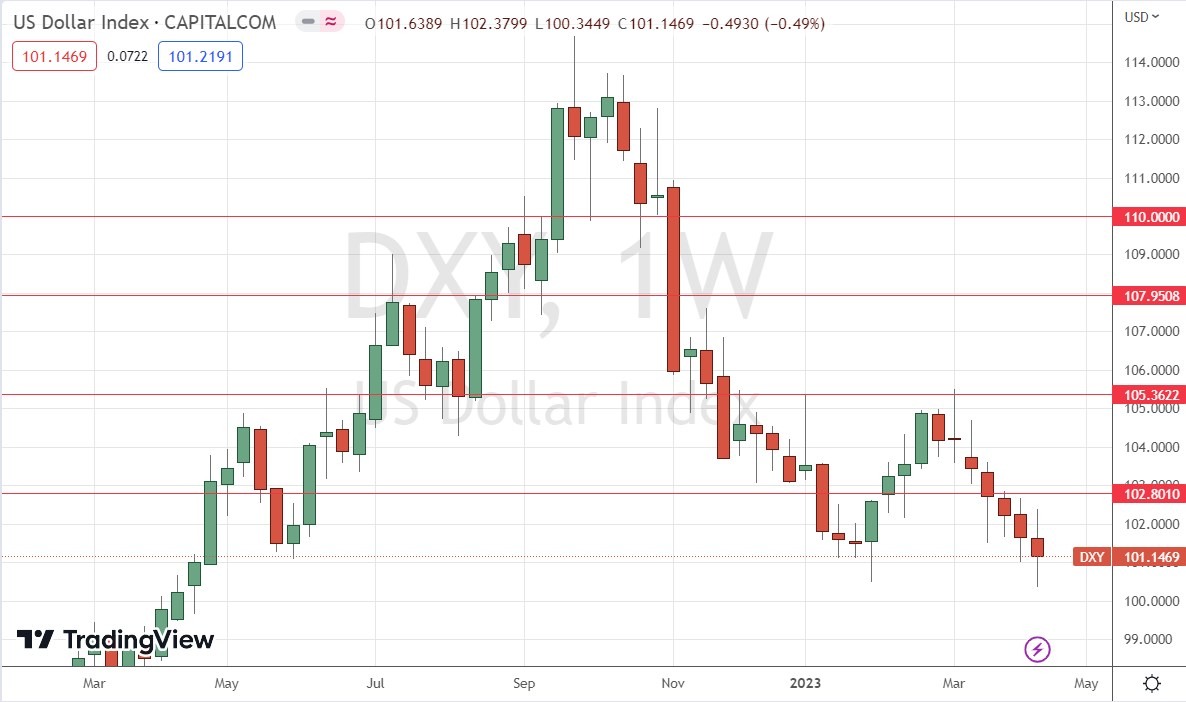
The weekly price chart below shows the U.S. Dollar Index again fell over the past week, and invalidated the key support level at 101.07, but also printed a large lower wick caused by Friday’s strong rally in the US Dollar. The weekly candlestick is almost a doji, which typically signifies indecision and potential reversal.
This suggests that we may be likely to see another fall over the coming week, which is reinforced by the long-term bearish trend in which the Dollar is trading below its levels of both 3 and 6 months ago.
However, the chance of a counter-trend rally is looking stronger over the next week, especially after Friday’s strong Dollar rally.
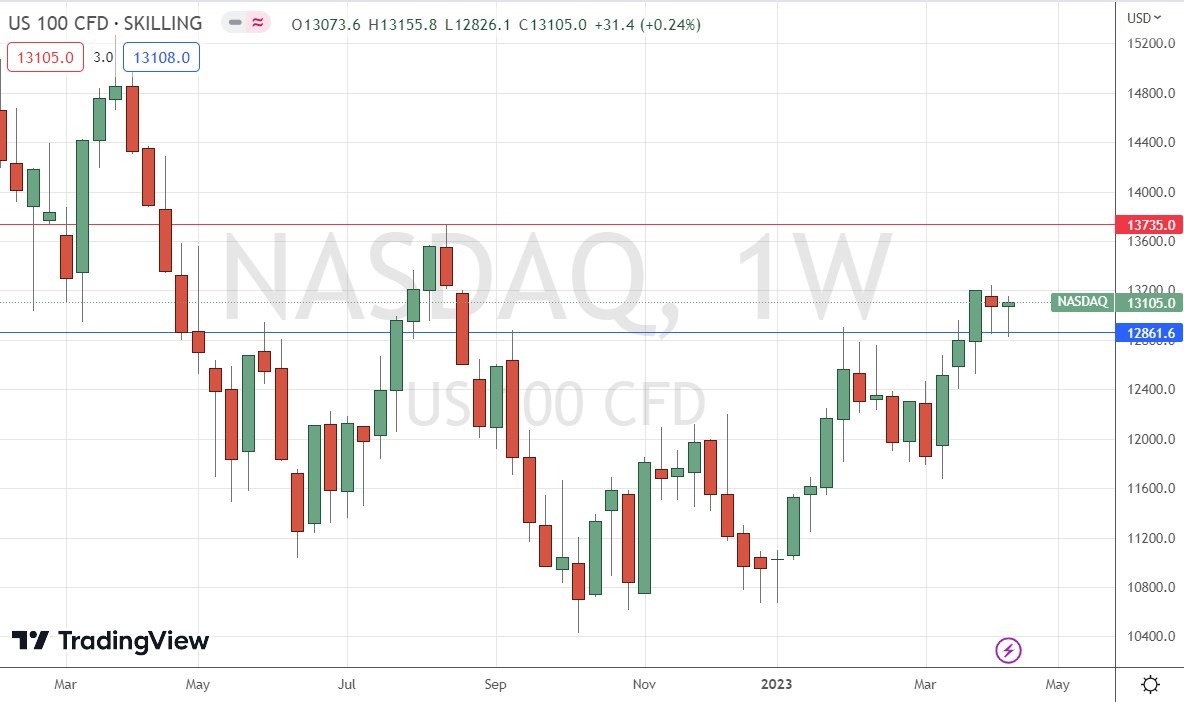
We saw a slight rise in the NASDAQ 100 Index over the week after last week’s slight decline from the earlier week’s new 7-month high. However, in the context of the wider price action, the technical picture here remains bullish, as both the last two weekly candlesticks are pin bars or near pins, and both quite strongly rejected the support level I identified at 12861.6.
There are no key resistance levels until 13735, so the price has room to rise over the coming week.
The NASDAQ 100 Index still looks like a buy, but bulls should be warned some major industry players are talking down the recent tech rally. However, the wider stock market is rising, which is another bullish sign.
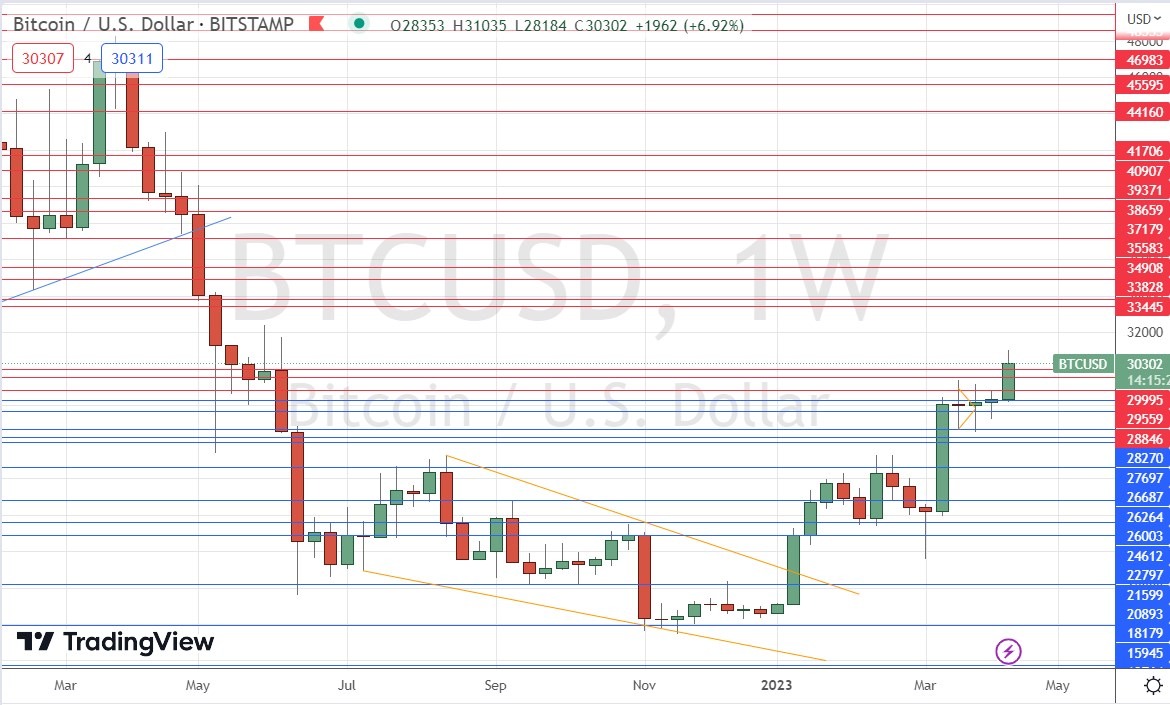
Last week saw the price of Bitcoin finally print a decisive bullish candlestick, making its breakout beyond the big round number at $30,000, after three indecisive weekly doji candlesticks. Breakouts after a period of strong compression can be especially strong, and the price has room to rise all the way to $33,445 before encountering any key resistance levels.
The price is in a bullish trend, having just reached a new 10-month high price.
There are good reasons for traders to be interested in Bitcoin right now on the long side, especially when the trend resumes on shorter time frames following the current bearish retracement within the bullish breakout (at the time of writing).
Bitcoin tends to rise when stock markets are rising (don’t believe the nonsense about Bitcoin as a hedge).
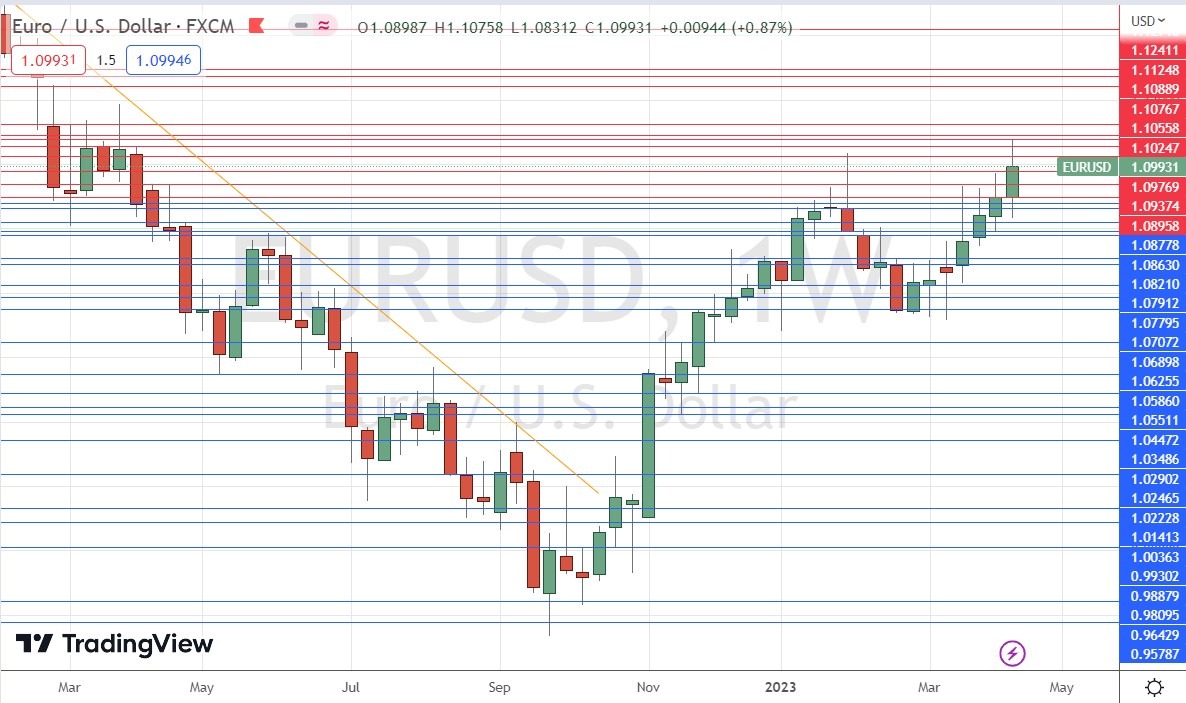
The EUR/USD currency pair rose to reach a new 1-year high price close to $1.1100 on Thursday but fell back to close just below the major round number at $1.1000. However, this currency pair tends to make deep pullbacks within statistically reliable trends, so there could be a good opportunity to buy the dips once bulls start pushing the price up firmly on shorter time frames such as H4 or H1.
Another bullish sign is that the weekly candlestick closed within the top half of its price range.
The bullish case is a bit weakened by the strong cluster of resistance levels between $1.1000 and $1.1100, which seemed to assert themselves on Friday.
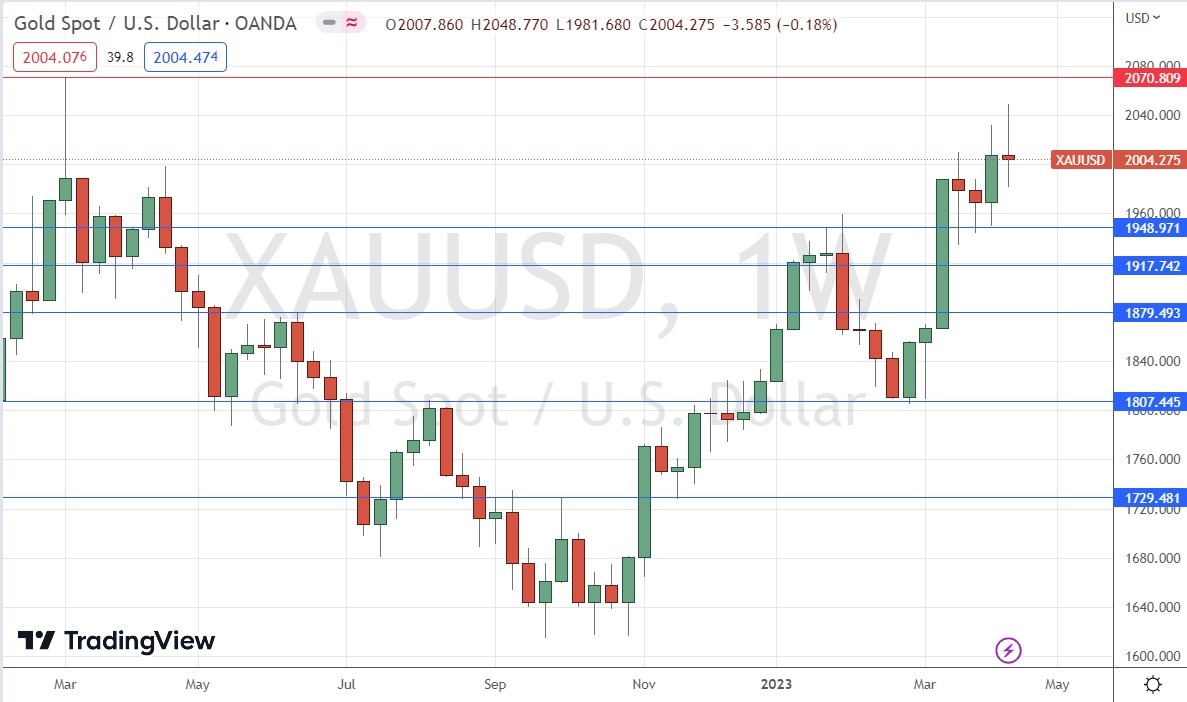
The price of Gold fell slightly last week but still closed above the round number at $2000, after making the highest weekly closing price in over two and a half years the previous week.
Although the price did print a new high during the last week, it failed to test its all-time high at $2070 and fell quite strongly on Friday.
I still believe Gold looks interesting on the long side, but as it is in a bearish retracement on shorter term timeframes, it may be best to drill down and wait for a bullish bounce once trading resumes this week before going long, ideally at $1950.
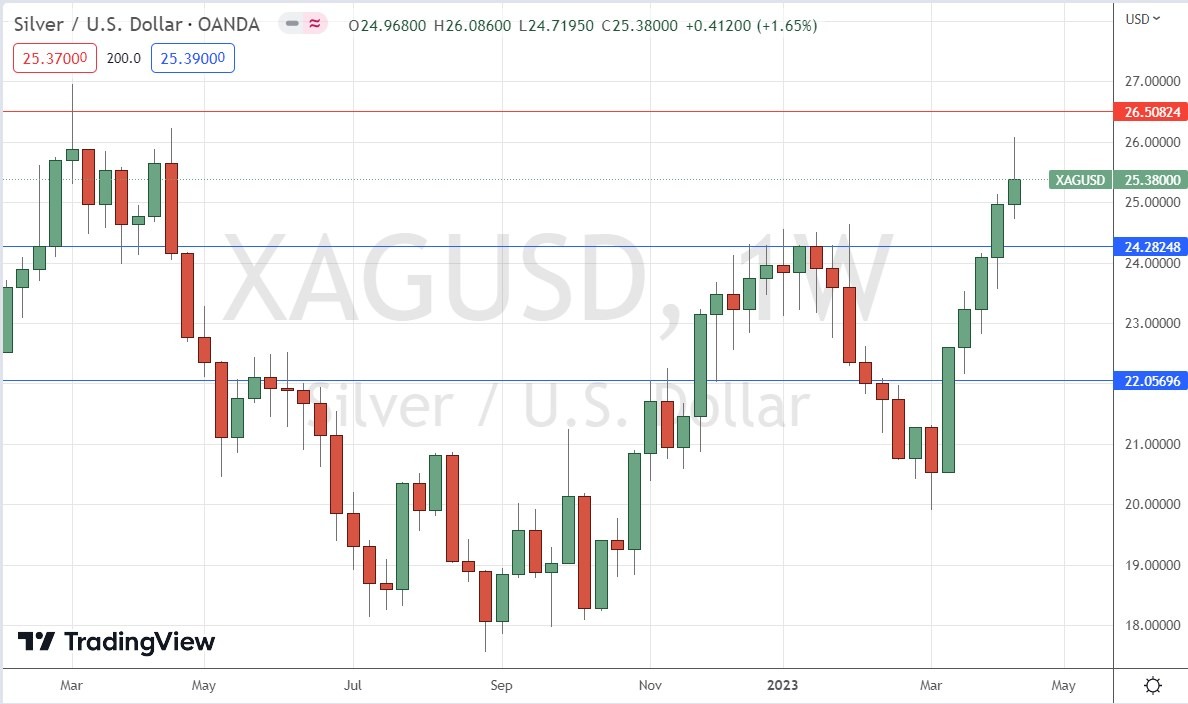
The price of Silver rose again last week to close below $25.50, making the highest weekly closing price in one year. Although the bullish weekly candlestick shown within the price chart below exhibits a large upper wick, the fact that the price is moving within “blue sky” should be encouraging for bulls.
I think Silver still looks interesting on the long side, but it faces strong resistance at $26.50 (and maybe also at $26.00) and took a hit on Friday as the Dollar advanced. The best approach may be to try to look for bullish reversals within the current bearish retracement on shorter time frames like H4 or H1, which may take a few attempts to get right.
I see the best trading opportunities this week as:
- Long Bitcoin against the USD following a bullish reversal on the H4 time frame above $30,000.
- Long of the EUR/USD currency pair following a bullish reversal on the H4 time frame.
- Long of the NASDAQ 100 Index.
- Long of Gold following a bullish rejection of $1950, or $1917.
- Long of Silver following a bullish reversal on the H4 time frame.
Ready to trade our weekly Forex analysis? We’ve made a list of the best brokers to trade Forex worth using.
[ad_2]
