[ad_1]
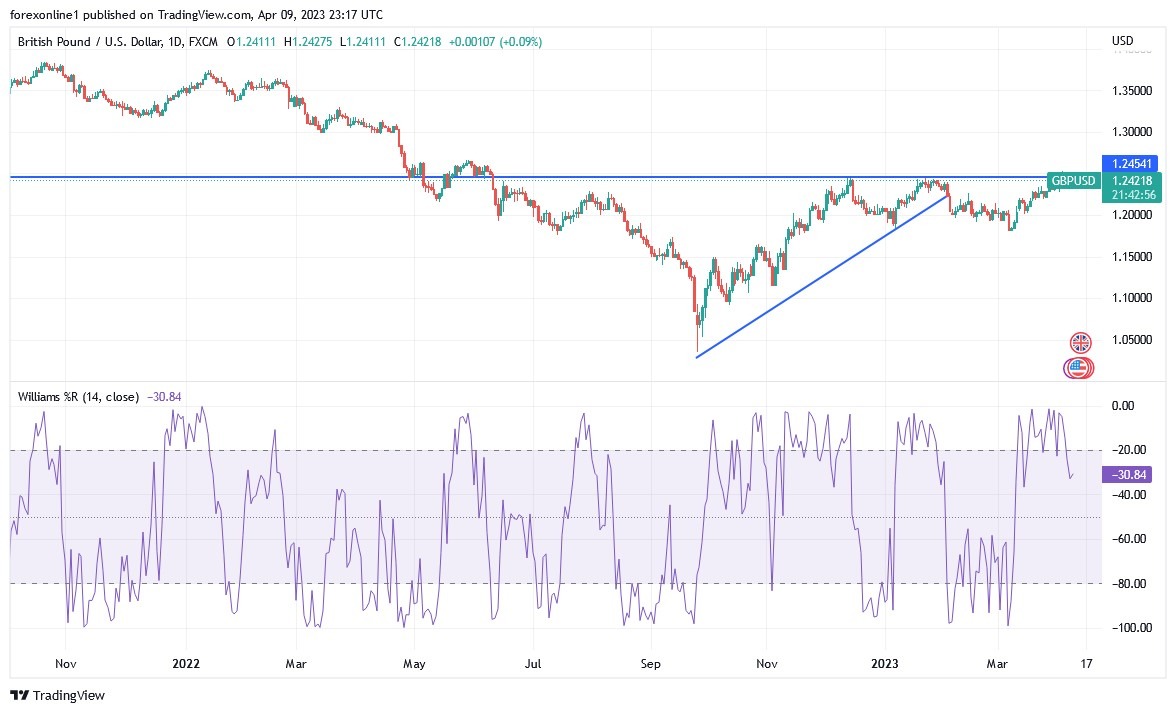
From the middle of last week’s trading, the price of the GBP/USD currency pair is exposed to profit-taking sales. This is after testing the resistance level 1.2525, its highest in 10 months. It closed the week’s trading around the level of 1.2416. This week, the currency pair will interact with the US jobs report, with anticipation of US inflation figures and the content of the minutes of the last meeting of the US Federal Reserve.
GBP/USD is trading on the back of the announcement that US Initial Jobless Claims for the week ending March 31st exceeded the expected claims count at 200k with a total rise of 228k. Prior to that, the ADP US Employment Change for March also came in below the expected number of jobs at 100K with 145K. While the ISM Services PMI lost the expected reading at 54.5 with a reading of 51.2. All ISM PMIs were also below estimates. Elsewhere, the S&P Global Services PMI and Composite PMI missing estimates of 53.8 and 53.3 respectively with readings of 52.6 and 52.3. Earlier in the same week, the ISM Manufacturing PMI and the S&P Global Manufacturing PMI were below estimates.
In the UK, the S&P Global Construction PMI for March missed the estimated reading of 53.5 with a reading of 50.7. Earlier in the same week, the S&P Global/CIPS Services reading for March beat expectations of 52.8 with a reading of 52.9, while the composite PMI for the period was in line with the estimate of 52.2.
- On the near term it appears that the GBP/USD is trading within a bearish channel formation.
- This indicates a significant short-term bearish bias in market sentiment.
- Therefore, the bears will be looking to extend the current downward path towards 1.2412 or below to support 1.2391.
- On the other hand, the bulls will be looking to pounce on profits around 1.2453 or higher at the 1.2473 resistance.
On the long term, and according to the performance on the daily chart, it appears that the GBP/USD is trading within a sharply bullish channel formation. This indicates a strong long-term bullish bias in market sentiment. Therefore, the bulls will target extended gains at around 1.2525 or higher at the resistance at 1.2595. On the other hand, the bears will be looking to pounce on pullbacks around 1.2328 or below at 1.2242 support.
On the 4-hour chart, we can see that the GBP/USD exchange rate has been on a slow upward trend in the past few months. During this rally, it was safe to buy on every dip as the pair formed higher highs and higher lows. GBP/USD moved above the 25-day and 50-day moving averages, which is a positive sign. However, it also formed a rising wedge pattern, and with this wedge pattern approaching its confluence, we cannot rule out a situation where the pair will decline in the coming days. And if this happens, the next reference point to watch will be at 1.2300. However, a move above the year-to-date high of 1.2528 would indicate that there are more buyers in the market.
Ready to trade our daily Forex analysis? We’ve made a list of the best brokers to trade Forex in the UK worth using.

[ad_2]