[ad_1]
The BTC/USD pair has been in a strong upward trend in the past few weeks.
- Set a buy-stop at 28,890 and a take-profit at 30,000.
- Add a stop-loss at 27,000.
- Timeline: 1-2 days.
- Set a sell-stop at 27,500 and a take-profit at 26,000.
- Add a stop-loss at 28,700.
Bitcoin’s price action has been relatively muted in the past few days as traders wait for the next catalyst and as liquidity remains sharply low. The BTC/USD pair was trading at 28,000 on Wednesday morning, where it has been in the past few days.
The BTC/USD pair has moved sideways even as the US dollar has pulled back in the past few days. The closely-watched US dollar index retreated to $101 on Wednesday, which is much lower than last year’s high of $115 and March’s high of $105.5.
In the past Bitcoin and the US dollar tend to have an inverse relationship with each other. In this, Bitcoin used to rise when the US dollar index was falling and vice versa. It now seems like this correlation has diverged in the past few days.
Bitcoin also moved sideways after a major peer-to-peer exchange suspended its operations. In a statement, Paxful announced that it was suspending its business and that it was unsure whether it will resume operations.
The management cited the departure of some key staff and the regulatory challenges for the situation. This was a major blow considering that Paxful was the biggest player in the P2P industry after LocalBitcoins closed its business last year.
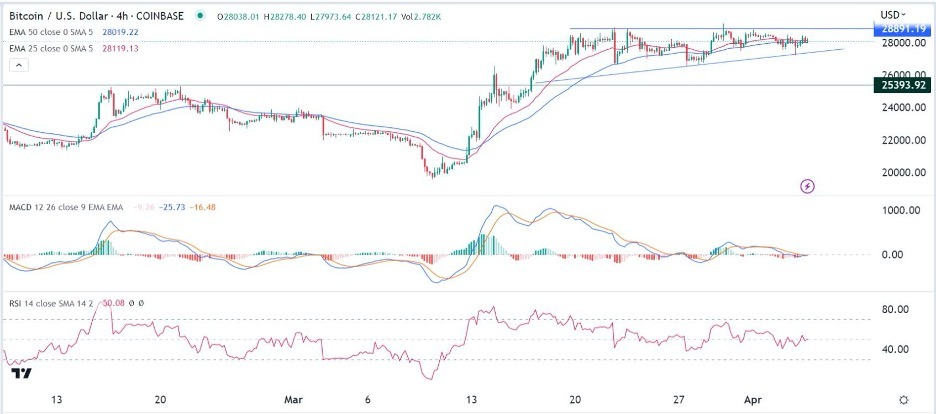
The BTC/USD pair has been in a strong upward trend in the past few weeks. It has jumped from the year-to-date low of about 15,500. The pair is consolidating at the 50-period moving average. At the same time, the MACD and the Relative Strength Index (RSI) have formed bearish divergence patterns.
The pair has formed a strong resistance point at 28,891, where it has struggled to move above in the past few weeks. It has also formed what looks like an ascending triangle pattern that is shown in blue while the Average True Range (ATR) has retreated.
Therefore, the outlook of the BTC/USD pair will be confirmed if the pair moves above the double-top level at 28,891. A volume-supported move above that level will signal that bulls have prevailed, which will push it to the next resistance point at 30,000. However, a move below the key support level at 27,200 will be a bearish sign.

[ad_2]