[ad_1]
The EUR/USD price made a strong recovery in March after falling by a multi-month low of 1.0523. It recovered to a high of 1.0928, the highest point since February 23.
- Sell the EUR/USD pair and set a take-profit at 1.0717.
- Add a stop-loss at 1.0925.
- Timeline: 1-2 days.
- Set a buy-stop at 1.0880 and a take-profit at 1.0950.
- Add a stop-loss at 1.0765.
The EUR/USD exchange rate pulled back on Monday morning, continuing the sell-off that started on Friday. It dropped to a low of 1.0850, the lowest level since Thursday, and ~0.80% below the highest point in March.
The EUR/USD pair erased some of the gains it made in March as traders started positioning for the new month. In all, the pair jumped in March as the banking crisis emerged and as the European Central Bank (ECB) hiked rates by 0.50%. The ECB has emerged as a more hawkish central bank than the Federal Reserve.
This hawkishness is mostly because of the need to lower inflation. Data published last week showed that inflation in the region was mixed in March. Headline inflation dropped sharply as natural gas prices plummeted to the lowest level since 2021.
However, core inflation, which avoids the most volatile food and energy prices, rose to a record high of 5.7%. This means that the ECB will need to continue hiking interest rates in the coming months. Its next meeting will be on May 4.
Looking ahead, there are several catalysts for the EUR/USD pair this week. S&P Global will publish the latest manufacturing and services PMI figures for the European Union and the United States. These numbers will have a minimal impact on the pair since their estimates were already published in March.
Other important numbers will be the latest American non-farm payrolls (NFP) numbers scheduled for Friday. These numbers are expected to show that the labor market remained tight in March.
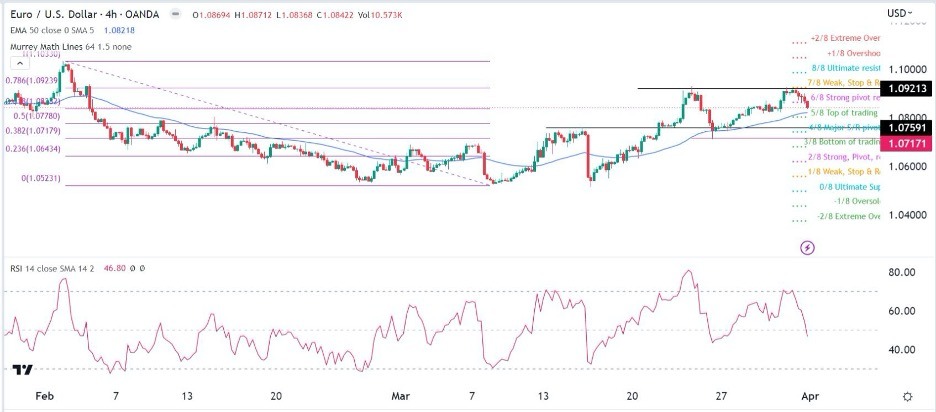
The EUR/USD price made a strong recovery in March after falling by a multi-month low of 1.0523. It recovered to a high of 1.0928, the highest point since February 23. On the four-hour chart, the pair rose to the 78.6% Fibonacci Retracement level and then pulled back to the 61.8% retracement point.
Most importantly, it has formed a double-top at ~1.0921 whose neckline is 1.0717. In technical analysis, this pattern is usually a bearish sign. The pair has also moved slightly below the strong pivot and reverse point of the Murrey Math Lines while the Relative Strength Index (RSI) has moved below the neutral point.
Therefore, because of the double-top pattern, the pair will likely have a bearish breakout, as sellers target the neckline of the double-top pattern at 1.0717.

Ready to trade our daily Forex signals? Here’s a list of some of the best Forex trading brokers worth considering.
[ad_2]