[ad_1]
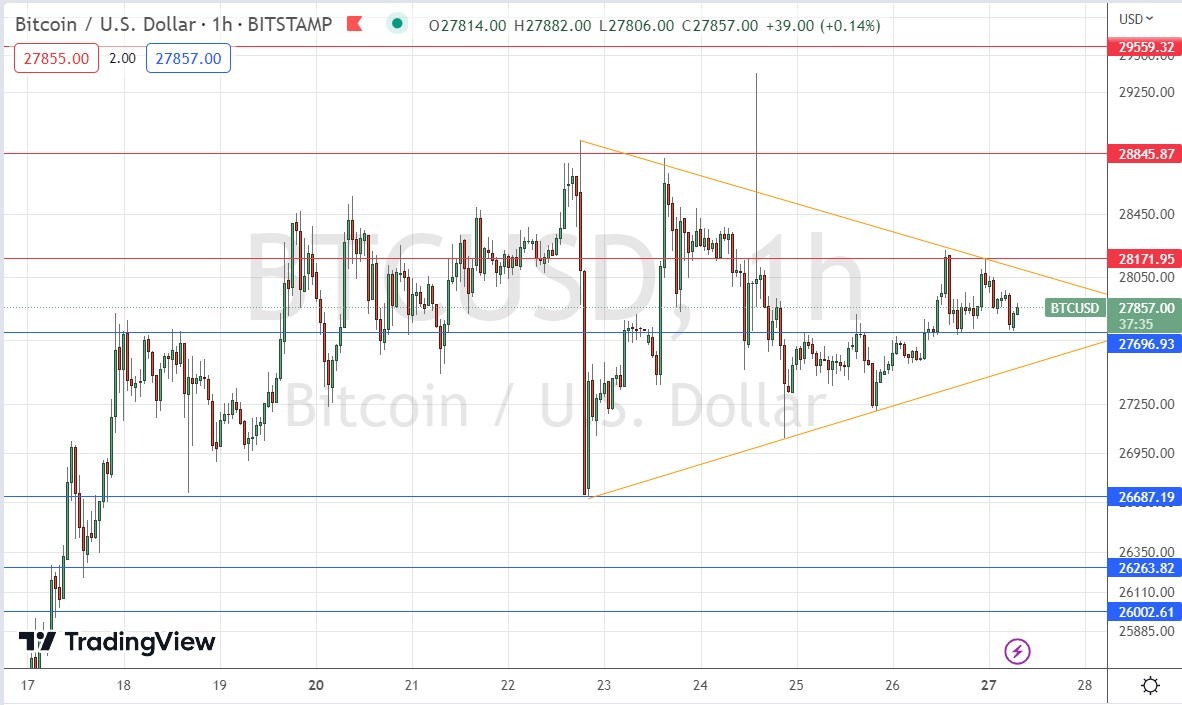
Support at $27,697 looks pivotal.
My previous BTC/USD signal on 23rd March was not triggered, as unfortunately the high price of the day never quite reached the key resistance level which I had identified at $28,846.
Risk 0.50% per trade.
Trades may only be entered before 5pm Tokyo time Tuesday.
- Go long after a bullish price action reversal on the H1 timeframe following the next touch of $27,697 or $26,687.
- Put the stop loss $100 below the local swing low.
- Move the stop loss to break even once the trade is $100 in profit by price.
- Take off 50% of the position as profit when the trade is $100 in profit by price and leave the remainder of the position to ride.
- Go short after a bearish price action reversal on the H1 timeframe following the next touch of $28,172 or $28,846.
- Put the stop loss $100 above the local swing high.
- Move the stop loss to break even once the trade is $100 in profit by price.
- Take off 50% of the position as profit when the trade is $100 in profit by price and leave the remainder of the position to ride.
The best method to identify a classic “price action reversal” is for an hourly candle to close, such as a pin bar, a doji, an outside or even just an engulfing candle with a higher close. You can exploit these levels or zones by watching the price action that occurs at the given levels.
I wrote in my previous analysis last Thursday that bulls should be concerned that the price seemed unable to rise above the resistance level at $27,818. If we had gotten a couple of consecutive higher hourly closes today above that level, I thought that Bitcoin would look much more bullish.
Unfortunately, after we got those higher closes, the price sold off quite strongly, so this was a bad call.
In trading it can be helpful to pay attention when seemingly good setups fail, so this can be taken as a bearish sign, despite the strong long-term bullish trend.
The technical picture now looks less bullish and more indecisive, as we see a consolidating triangle chart pattern has formed, shown in the price chart below. Within this triangle, there is a support level at $27,697 that is currently holding up the price.
The resistance nearby just above the triangle at $28,172 also looks important.
I think the price could go either way, although a significant directional move may not happen today as it is Monday which is typically a quiet market.
If we get two consecutive higher hourly closes above $28,172 traders can take that as a signal to go long.
If we get two consecutive lower hourly closes below $27,250 traders can take that as a signal to go short.
On a higher timeframe, zoomed out price chart, Bitcoin looks quite bullish due to the long-term trend. Yet a significant breakdown below this consolidating triangle pattern does look likely to trigger a deeper pullback, which could then give a dip-buying opportunity at $26,687.

There is nothing of high importance scheduled today concerning the US Dollar.
Ready to trade our daily Bitcoin crypto signals? Here’s our complication of the best cryptocurrency brokers worth checking out.
[ad_2]
