[ad_1]
The GBP/USD pair initially rose on Tuesday after the UK published the strong jobs numbers.
Bullish view
- Set a buy-stop at 1.2271 and a take-profit at 1.2350.
- Add a stop-loss at 1.2110.
- Timeline: 1-2 days.
Bearish view
- Set a sell-stop at 1.2135 and a take-profit at 1.2050.
- Add a stop-loss at 1.2235.
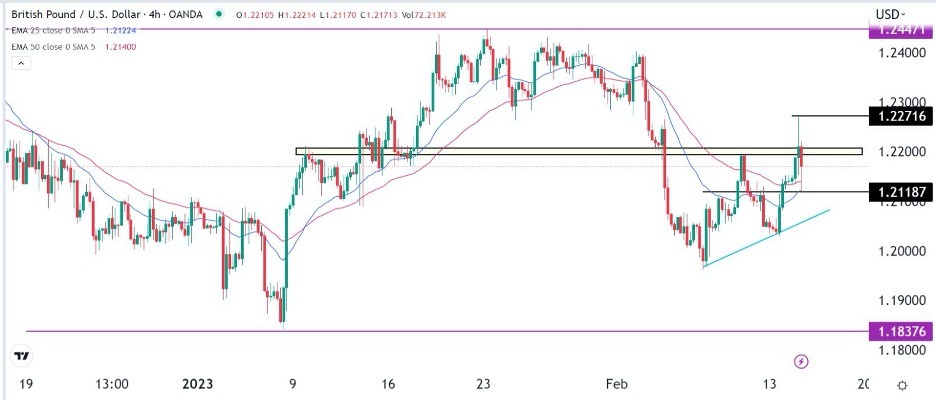
The GBP/USD exchange rate pulled back after the strong American inflation and UK jobs numbers. After initially rising to a multi-week high of 1.2267, the pair then pulled back to an intraday low of 1.2118. The pair’s next key catalyst will be the upcoming UK consumer and producer price index data scheduled for Wednesday.
UK inflation and US retail sales numbers
The GBP/USD pair initially rose on Tuesday after the UK published the strong jobs numbers. According to the Office of National Statistics (ONS), the country’s unemployment rate remained unchanged at 3.7% as the economy added over 74k jobs in the three months to December. Average earnings without bonus rose to 6.7%.
Sterling’s gains were short-lived and pulled back after the US published January’s inflation data. According to the Bureau of Labor Statistics (BLS), the country’s inflation rose to 0.5% on a monthly basis. It then pulled back to 6.4%, which was significantly higher than where it was before the pandemic started.
The GBP/USD pair will have two important catalysts on Wednesday. The most important one will be the upcoming UK inflation numbers. Like in the US, inflation is expected to have remained stubbornly high in February.
Precisely, the headline inflation is expected to come in at 10.3% while core CPI will be at 6.2%. The two are still higher than the Bank of England (BoE) target of 2.0%. In its meeting this month, the BoE signaled that it would hike rates and then take a strategic pause in the coming months.
There will be other important economic numbers from the United States. The Commerce Department will deliver the latest retail sales data. Sales dropped by 1.1% in December and 0.6% in November. Analysts expect that they rebounded slightly in January. Other important numbers will be the latest New York manufacturing index and industrial production.
GBP/USD forecast
A spinning top candlestick formed on the four-hour chart after the UK jobs and US inflation numbers. In price action analysis, this pattern is usually a bearish sign. The pair has moved slightly below the important resistance point at 1.2193 (Feb 9 and Jan 9 high). It is also slightly above the 25-period exponential moving average.
Therefore, it seems like there is indecision. As such, a bullish breakout, which is reinforced by a double-bottom pattern, will be confirmed if it moves above the upper side of the spinning top at 1.2271. On the other hand, a move below the support at 1.2118 will signal that bears have prevailed.

[ad_2]