[ad_1]
The GBP/USD price will also react to the upcoming UK job numbers.
Bearish view
- Sell the GBP/USD pair and set a take-profit at 1.1837.
- Add a stop-loss at 1.2300.
- Timeline: 1-2 days.
Bullish view
- Set a buy-stop at 1.2165 and a take-profit at 1.2250.
- Add a stop-loss at 1.2085.
The GBP/USD exchange rate rose slightly ahead of the upcoming American inflation and UK jobs data. It was trading at 1.2131, a few points above the lowest point last week. This slow recovery happened as American equities rose, the US dollar index retreated, and the yield curve inversion continued.
US inflation and UK jobs data
There will be several important market-moving events this week. The most important will happen on Tuesday when the US will publish January’s inflation numbers. Headline inflation is expected to come in at 6.2%, slightly lower than December’s 6.5%. If this is the figure, then it will be the 7th month of CPI declines. However, economists believe that inflation rose to 0.4% on a month-on-month basis.
Core inflation, on the other hand, is expected to come in at 0.4% on a MoM basis and by 5.5% on an annual basis, respectively. These numbers will help the Fed to determine the pace of rate increases in the upcoming meetings.
The GBP/USD price will also react to the upcoming UK job numbers. The country’s labor market is holding on well as the unemployment rate is expected to stay at 3.4%. However, the UK is facing substantial challenges as it moves toward a recession.
For example, in London, the high street is crumbling, with many retailers closing. The number of company closures in 2022 jumped while the cost of living has remained elevated. Recent data showed that the UK has the highest childcare costs in the G7. At the same time, several industries that supported its growth like automobiles and semiconductors are shrinking.
The GBP/USD will also react to Wednesday’s inflation numbers. These numbers will likely show that inflation remained substantially high in January, which will put pressure on the Federal Reserve.
GBP/USD forecast
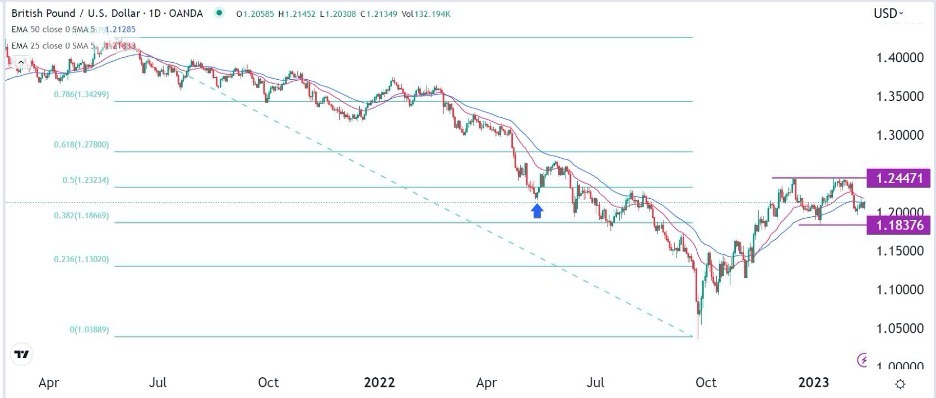
The longer-term daily chart reveals that the GBP to USD pair created a double-top pattern at 1.2447. This pattern formed in December and January while its neckline is at 1.1837. The pair has moved slightly below the 50% Fibonacci Retracement level. The current price is also important since it was the lowest point on May 12 last year.
Therefore, the outlook for sterling is a bit bearish, which could see it retest the neckline of the double-top at 1.1837 (Jan 9 low). The bearish move will become invalidated if the pair moves above the resistance point at 1.2447.

[ad_2]