[ad_1]
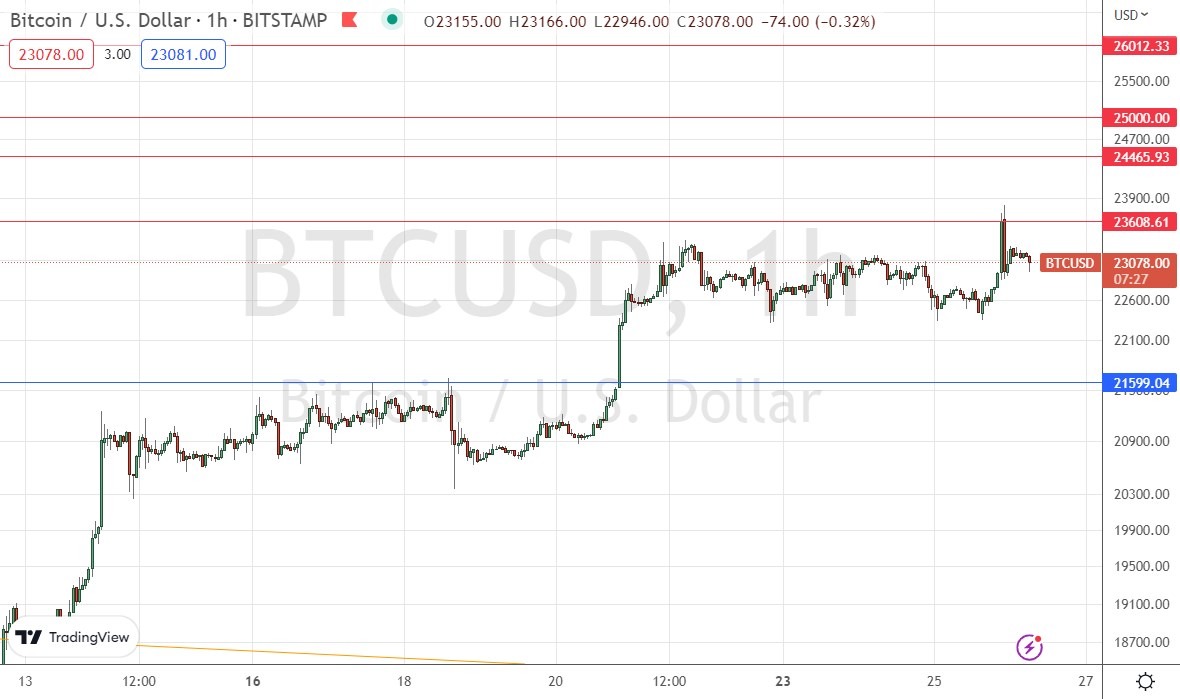
Cluster of Resistance Levels Beginning at $23,162.
Bitcoin’s strong bullish move is looking likely to slow down dramatically as it runs into several resistance levels.
Previous BTC/USD Signal
My previous Bitcoin signal on 4th January produced a losing short trade from the bearish rejection of $16,049.
Today’s BTC/USD Signals
Risk 0.50% per trade.
Trades may only be entered before 5pm Tokyo time Friday.
Long Trade Idea
- Go long after a bullish price action reversal on the H1 timeframe following the next touch of $21,599.
- Put the stop loss of $100 below the local swing low.
- Move the stop loss to break even once the trade is $100 in profit by price.
- Take off 50% of the position as profit when the trade is $100 in profit by price and leave the remainder of the position to ride.
Short Trade Ideas
- Go short after a bearish price action reversal on the H1 timeframe following the next touch of $23,609, $24,466, or $25,000.
- Put the stop loss $100 above the local swing high.
- Move the stop loss to break even once the trade is $100 in profit by price.
- Remove 50% of the position as profit when the trade is $100 in profit by price and leave the remainder of the position to ride.
The best method to identify a classic “price action reversal” is for an hourly candle to close, such as a pin bar, a doji, an outside or even just an engulfing candle with a higher close. You can exploit these levels or zones by watching the price action that occurs at the given levels.
BTC/USD Analysis
I wrote in my previous analysis that the resistance at $16,949 was likely to be very pivotal, and therefore a good entry point for a short trade in line with the long-term bearish trend.
This was not a good call as the price began an exponential bullish acceleration that day which led to a long-term breakout and bullish reversal of the bearish trend.
Bitcoin’s technical picture has changed dramatically over the past few weeks, as it has continued to rise to well above $20k where it has not traded for some months.
The key takeaway is that while there is a bullish trend and residual bullish momentum, the price has arrived at an area of a cluster of resistance levels which are very likely to slow, if not halt, the strong rise in price which has been seen lately.
As this momentum would very likely take a while to turn around, I do not want to take any short trades here today, but I doubt there will be any good long trade entry opportunities either unless we get a bearish retracement back to the closest support level at $21,599.
If the price gets established above $23,609 quickly without retracing back to $21,599 that will be a sign of strong bullish momentum.
It looks like Bitcoin is back.

Concerning the US Dollar, there will be a release of Advance GDP data at 3pm London time.
Ready to trade our free Bitcoin trading signals? We’ve made a list of the best Forex crypto brokers worth trading with.
[ad_2]
