[ad_1]
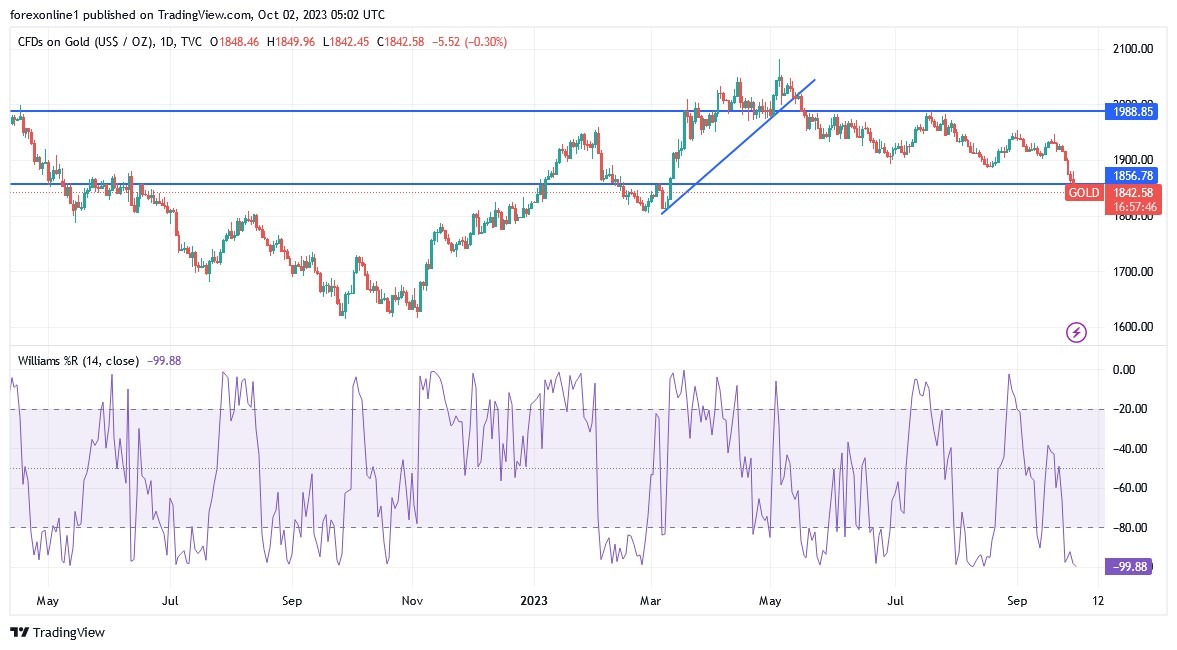
At the end of last week’s trading, gold futures continued their losses after announcing a rise in the US inflation measure favored by the Federal Reserve for the second month in a row. This made some investors expect that the US central bank would pull the trigger to raise US interest rates again this year. It is a strong bearish factor for the gold market, and as a result, gold prices (XAU/USD) fell to the support level of $1846 per ounce, its lowest in nearly seven months. The week’s trading closed stable around those losses. Accordingly, the price of the yellow metal recorded a weekly loss of approximately 4%, which reduces its gains since the beginning of the year to less than 3%.
Forex Brokers We Recommend in Your Region
See full brokers list
In the same performance, silver prices, which is the sister commodity to gold, stabilized, and silver futures contracts remained unchanged at $22.74 per ounce, but they suffered a sharp weekly loss of approximately 5%. Year-to-date, the price of the white metal has fallen by approximately 6%.
Despite the decline in US dollar and Treasury bond yields, gold prices are still declining at the end of the week’s trading, driven by expectations of a rise in US interest rates in the long term. Economic data also played a role, as various numbers indicated the possibility of another interest rate hike by the US central bank this year.
According to the Bureau of Economic Analysis (BEA), the US personal consumption expenditures (PCE) price index rose to 3.5% year over year in August, up from an upwardly revised 3.4%. The personal consumption expenditures index also increased by 0.4% on a monthly basis. The annual core PCE index, which excludes volatile energy and food components, fell to 3.9%, down from an upwardly revised 4.2%. The core PCE index was almost flat at 0.1%.
In addition, personal spending rose 0.4% in August, down from the upwardly revised reading of 0.9% in July. Personal income jumped 0.4% from 0.2%. Overall, consumer sentiment continued to weaken as the US University of Michigan Consumer Confidence Index fell to 68.1 in September, down from 69.5 the previous month. Inflation expectations for the next year and five years fell to 3.2% and 2.8%, respectively.
US Treasury yields were falling, with the 10-year bond yield falling by 2.8 basis points to 4.569%. The yield on two-year bonds fell by 2.5 basis points to below 5.05%, while the yield on 30-year bonds fell by 2.5 basis points to 4.905%. The gold market is usually sensitive to interest rate movements because it affects the opportunity cost of holding non-yielding bullion.
The US Dollar Index (DXY), a measure of the dollar against a basket of other major currencies, fell to 106.08, down from 106.22. But the index is still ready to record weekly gains of 0.5%, in addition to its annual rise of 2.5% since the beginning of the year. As is known, the weakness of the US dollar is beneficial for goods priced in dollars because it makes it cheaper for foreign investors to buy them.
As for other metals markets, copper futures rose to $3.7345 per pound. Platinum futures rose to $912.90 an ounce. Palladium futures fell to $1,265.00 per ounce.
- XAU/USD gold price continues to trade below the 100-hour moving average line on the hourly chart.
- Friday’s rebound pushed the gold price away from oversold levels of the 14-hour RSI and into normal trading territory.
- In the near term, and according to the performance on the hourly chart, it appears that the gold price, XAU/USD, has recently completed an upward breakout from the descending channel formation.
- The MACD indicator for this period also appears to be supporting an uptrend after completing a bullish crossover.
Therefore, the bulls will look to extend the current winning streak towards $1881 or higher to the $1892 resistance. On the other hand, the bears will target short-term pullbacks at around $1860 or lower at the support of $1849 per ounce.
In the long term, and according to the performance on the daily chart, it appears that the XAU/USD pair is trading within a descending channel. The daily MACD also appears to be supporting a downward trend after completing a bearish crossover. Therefore, the bears will look to extend the current declines towards the $1834 support or lower to $1800 per ounce respectively. On the other hand, the bulls will target long-term profits at around $1,900 or higher at the $1,934 resistance.
Ready to trade our Gold price forecast? We’ve made a list of the best Gold brokers worth trading with.

[ad_2]