[ad_1]
Forex Brokers We Recommend in Your Region
See full brokers list
My previous signal on 19th September did not produce a trade entry signal as there was no bearish price action when the resistance levels I had identified were first reached.
Risk 0.75%
Trades must be taken before 5pm Tokyo time Thursday.
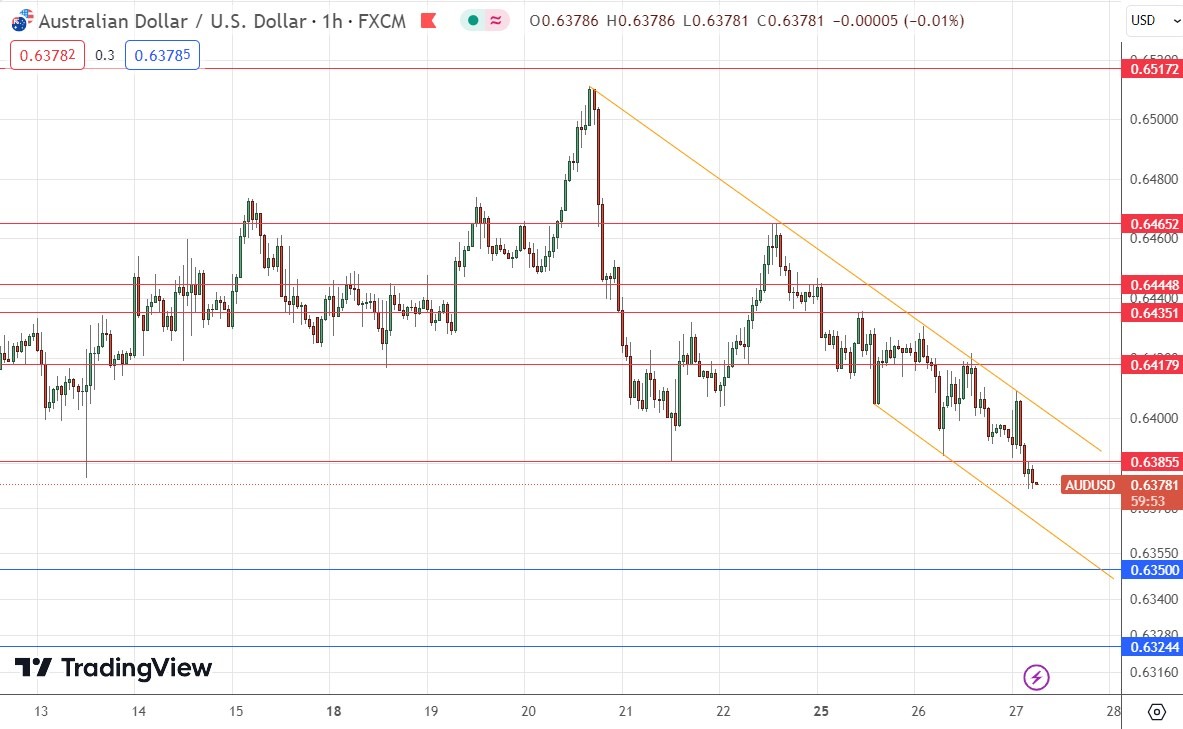
- Short entry following a bearish price action reversal on the H1 time frame immediately upon the next touch of $0.6386 or $0.6418.
- Put the stop loss 1 pip above the local swing high.
- Adjust the stop loss to break even once the trade is 20 pips in profit.
- Take off 50% of the position as profit when the price reaches 20 pips in profit and leave the remainder of the position to run.
- Long entry following a bullish price action reversal on the H1 time frame immediately upon the next touch of $0.6350 or $0.6324.
- Put stop loss 1 pip below the local swing low.
- Adjust the stop loss to break even once the trade is 20 pips in profit.
- Take off 50% of the position as profit when the price reaches 20 pips in profit and leave the remainder of the position to run.
The best method to identify a classic “price action reversal” is for an hourly candle to close, such as a pin bar, a doji, an outside or even just an engulfing candle with a higher close. You can exploit these levels or zones by watching the price action that occurs at the given levels.
I wrote in my previous forecast that the AUD/USD currency pair was likely to just chop around, possibly giving small scalping opportunities off both support or resistance. However, I thought that the best opportunity which might set up would be a bearish breakdown below $0.6400.
This was enough to stay out of trouble, but I was completely wrong over the short term, as the price rose quite strongly over the next several hours.
The picture now is very bearish, for several reasons, mostly technical, but due to market sentiment as well which is risk-off and sending money flowing into the US Dollar and out of riskier assets, which is putting downwards pressure on this currency pair.
The technical reasons are:
- The price action is bearish.
- There are no key support levels until $0.6350.
- The price is very close to making new multi-month lows.
- Over the past few days, the price chart below shows that the price action has been contained within what now seems to be a bearish price channel.
- It seems likely that there is a new resistance level just overhead at $0.6386.
If the price remains below $0.6386, I think the outlook is bearish. I think that entering a short trade from a bearish rejection of this level or even the one above it could be a good opportunity if it sets up today.
It is possible just to go short without using resistance, but without a consolidation or reversal into the trend, that is usually quite risky.
There was a release of Australian inflation data a few hours ago, but it came in exactly at the level, which was widely expected, at an annualized rate of 5.2%, so this is probably having no impact.

There is nothing of high importance scheduled today concerning either the AUD or the USD.
Ready to trade our daily Forex signals? Compare this list of the best Forex platforms in Australia worth reviewing.
[ad_2]