[ad_1]
Forex Brokers We Recommend in Your Region
See full brokers list
- Buy the GBP/USD pair and set a take-profit at 1.2880.
- Add a stop-loss at 1.2680.
- Timeline: 1-2 days.
- Set a sell-stop at 1.2715 and a take-profit at 1.2650.
- Add a stop-loss at 1.2825.
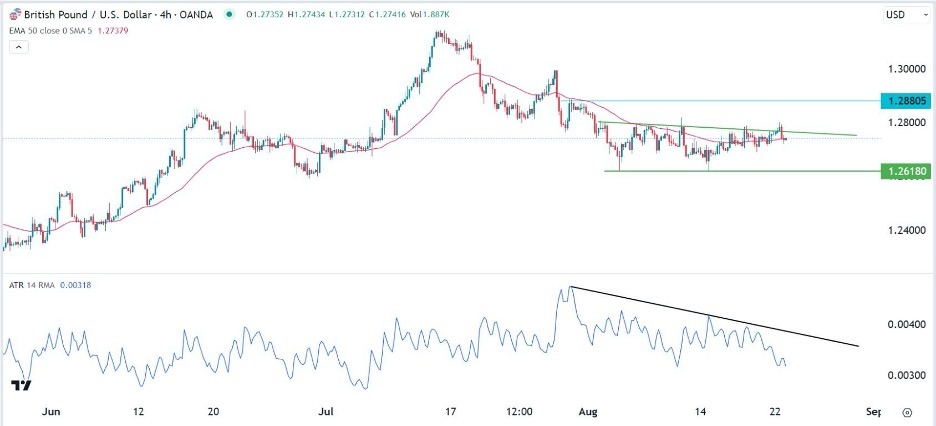
The GBP/USD pair continued wavering on Wednesday after the encouraging UK public borrowing data and weak US housing numbers. The pair was trading at 1.2734, a few points below this week’s high of 1.2794.
The GBP/USD pair has been a bit muted this week because of the relatively immaterial economic numbers from the UK and the US. The two countries have already published the closely watched inflation and jobs numbers.
On Tuesday, the UK released encouraging numbers. Data showed that public sector net borrowing came in at 4.3 billion pounds in July, below the expected 6 billion pounds. This happened as the UK collected more funds in taxes during the month.
Therefore, there is growing calls by conservatives for the country to implement tax cuts to boost the economy. In a statement, Jeremy Hunt, the Chancellor, noted that this was not the best time to cut rates. He insisted that a rate cut wil only happen when the UK takes control of inflation.
The GBP/USD pair also reacted mildly to US existing home sales numbers. The data revealed that sales dropped by 2.2% in July to 4.07 million. Economists polled by Refinitiv were expecting the data to show that sales dropped to 4.15 million.
The housing sector is facing major headwinds as mortgage rates soar to the highest level in over 22 years. There is also an ongoing supply shortage as developers battle with the labor shortage. The US will publish the latest new home sales data later on Wednesday.
The other important data to watch on Wednesday will be the flash manufacturing and services PMI numbers from the UK and the US. These numbers will come ahead of the upcoming Jackson Hole Symposium.
The GBP/USD pair has moved in a sideways mode in the past few weeks. On the 4H chart, the pair is hovering at the 25-period and 50-period moving averages. It has also remained below the descending trendline shown in black.
The Average True Range (ATR) has continued falling, signaling that volatility has dropped. A closer look shows that the pair has formed an inverted head and shoulders pattern, which is usually a bullish sign.
Therefore, the pair will likely have a bullish breakout in the coming days. If this happens, the next reference level to watch will be at 1.2880 (July 28 high).

Ready to trade our free daily Forex trading signals? We’ve shortlisted the best UK forex broker in the industry for you.
[ad_2]