[ad_1]
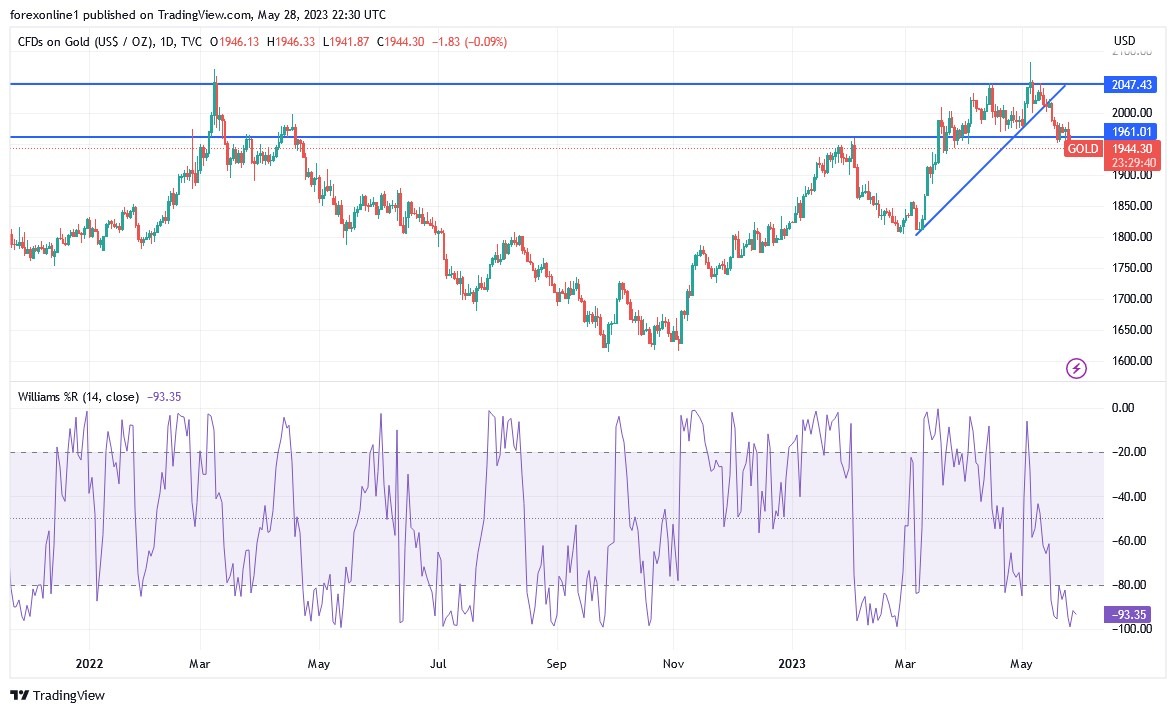
By the end of last week’s trading, the XAU/USD gold price retreated from its session high at around $1957 an ounce, to trade at around $1937, after the last round of important and influential economic data. Trading began this important week, stable around the level of 1945 dollars an ounce. All in all, the price of gold has now declined to trade a few levels below the 100-hour moving average line. As a result, gold price appears to have turned around the oversold levels of the 14-hour RSI.
Wall Street markets remain focused on Washington and the ongoing negotiations for a deal to raise the US government’s debt ceiling and avoid a default that could be catastrophic. Officials said US President Joe Biden and House Speaker Kevin McCarthy are narrowing the scope of a two-year budget agreement that could open the door to raising the country’s debt ceiling. The Democratic president and Republican speaker hope to reach a compromise on the budget this weekend.
Wall Street and the broader economy already had a whole list of concerns before the threat of a US default became sharply high on the list.
The key measure of inflation that the Fed watches closely rose higher than economists expected in April. Persistent pressure from inflation is complicating the Fed’s fight against higher prices. The central bank has been aggressively raising interest rates since 2022, but recently indicated that it would likely give up on a rate hike when it meets in mid-June. The government’s latest inflation report raises concerns about the Fed’s next move.
The XAU/USD gold price is trading on the latest data results, as the US Durable Goods Orders for April exceeded the expected change of -1% with a change of -1.1%. Previous Defense Durable Goods Orders missed the estimate of 0.1% with a change of -0.2%, while Non-Aircraft Durable Goods Orders missed the expected change of -0.1% with a change of -0.2%.
The April core PCE price index beat forecast (MoM) by 0.3% with a change of 0.4%, while the equivalent (YoY) beat expectations of 4.6% with a change of 4.7%. In the same week, last week’s US Initial Jobless Claims exceeded the expected claims number of 245k with a count below 229k, while the previous week’s continuing claims exceeded expectations of 1.8m with a total of 1.794m. US annual GDP for the first quarter beat expectations by 1.1% with a change of 1.3%.
- In the near term and according to the performance of the hourly chart, it appears that the XAU/USD gold price is trading within a bearish channel formation.
- This indicates a significant short-term bearish bias in market sentiment.
- Therefore, the bears will be looking to extend the current range of declines towards $1937 or lower at $1930 an ounce.
- On the other hand, the bulls will be looking for a bounce around $1950 or higher at the $1957 resistance.
On the long term and according to the performance on the daily chart, it appears that the XAU/USD gold price is trading within a bearish channel formation. This indicates a significant long-term bearish bias in market sentiment. Therefore, the bears will be looking to extend the current range of declines towards $1902 or lower at $1865 an ounce. On the other hand, the bulls will look to pounce on long-term profits at around $1983 or higher at $2025 an ounce
Ready to trade our Gold forecast? We’ve shortlisted the best Gold brokers in the industry for you.

[ad_2]
