[ad_1]
The difference between success and failure in Forex / CFD trading is highly likely to depend mostly upon which assets you choose to trade each week and in which direction, and not on the exact methods you might use to determine trade entries and exits.
So, when starting the week, it is a good idea to look at the big picture of what is developing in the market as a whole, and how such developments and affected by macro fundamentals, technical factors, and market sentiment. There are a few valid long-term trends in the market right now, which might be exploited profitably. Read on to get my weekly analysis below.
I wrote in my previous piece on 14th May that the best trade opportunities for the week were likely to be:
- Long of the NASDAQ 100 Index. The Index ended the week 4.08% higher.
- Day trading the USD/JPY currency pair on the long side. This currency pair ended the week higher by 1.60%.
- Buying Gold if it bounces convincingly at key support levels like $1949 or $1918. This did not set up.
- Going short of WTI Crude Oil if we get a daily close below $65. This did not set up.
My forecast produced an overall win of 5.68%, averaging a gain of 1.42%.
Markets are currently dominated by two ongoing debates in the USA – whether the Federal Reserve has really completed its cycle of rate hikes, and how the impasse over the debt ceiling will be resolved (nobody really expects the USA to default). As opinion on these issues swing back and forth, the Dollar and stock markets swing up and down, with analysts scrutinizing every piece of US data for clues as to what the Fed will likely do at its next policy meeting in June.
We have seen weaker than expected US retail sales data but also hawkish rhetoric from FOMC members over the past week, which has boosted the greenback and overall, probably supported the case for rate hikes. We saw a rise in most stock indices, but the major rise was seen in tech stocks, with the NASDAQ 100 Index having a great week as it closed Friday more than 4% higher than it opened on Monday, and reaching long-term highs not seen in more than one year.
On the inflation front, Canadian CPI data came in higher than expected, posting a monthly increase of 0.7% when only 0.5%, which has slightly increased nervousness over the potential persistence of US inflation, although the core rate fell which was seen as good news.
Markets will now be focused on the coming release of US FOMC Meeting Minutes and Preliminary GDP data, as well as the Core PCE Price Index. Away from the USA, the Reserve Bank of New Zealand is holding a policy meeting this week which is expected to bring another 25bps rate hike to a rate of 5.50%.
Last week’s other key data releases were:
- US Unemployment data – this came in very close to expectations.
- US Empire State Manufacturing Index data – this came in a bit worse than expected.
- UK Claimant Count Change– this came in a bit worse than expected.
- Australian Wage Price Index data – this came in just a fraction better than had been expected, which may lead Australian inflation expectations to be revised downward a little.
- Australian Unemployment data – this came in much worse than expected, jumping from 3.5% to 3.7% unexpectedly, which would be more evidence of a cooling economy perhaps not needing more rate hikes yet.
The coming week in the markets is likely to see a slightly higher level of volatility thank last week, as there are more scheduled high-impact releases this week than there were last week. This week’s key data releases are, in order of importance:
- US FOMC Meeting Minutes
- US Core PCE Price Index data
- US Preliminary GDP data
- British CPI (inflation) data
- RBNZ Official Cash Rate & Monetary Policy Statement
- Flash Manufacturing & Services PMI data in the USA, Germany, UK, and France.
Monday will be a public holiday in Canada.
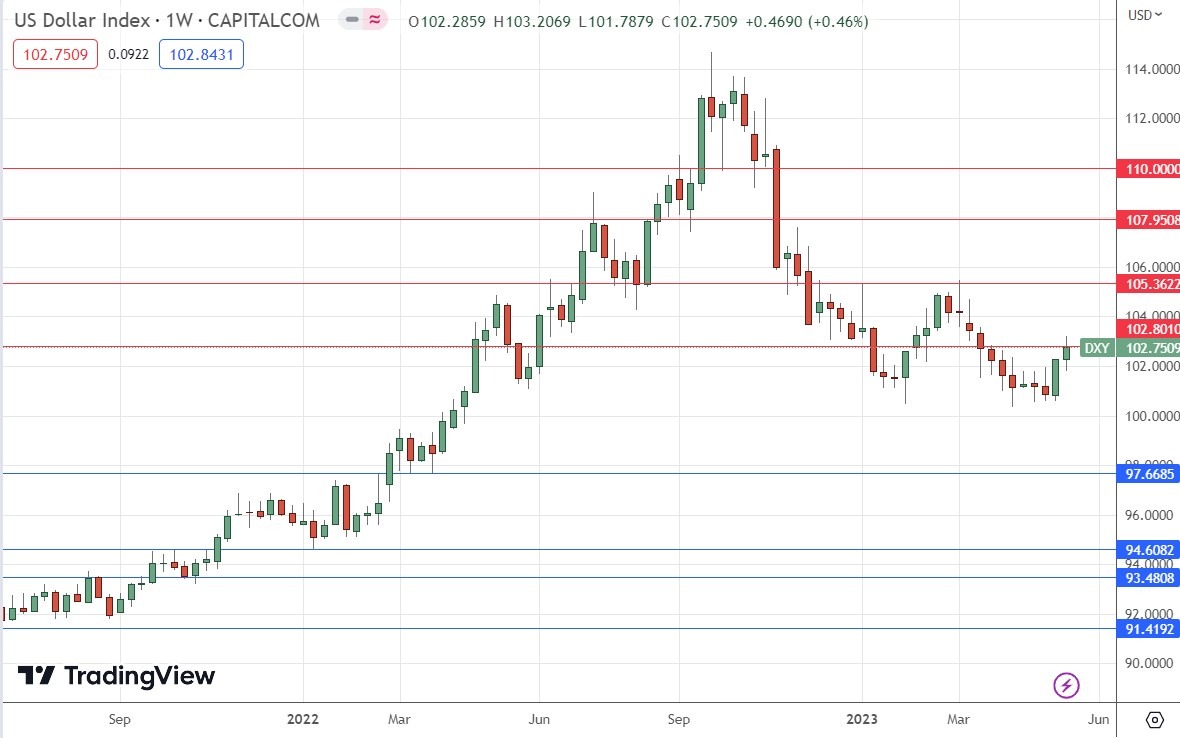
The weekly price chart below shows the U.S. Dollar Index made a modest gain last week against its long-term bearish trend but was held by the key resistance level which I had identified at 102.80.
The weekly candlestick is a bullish candlestick but has an upper wick. This candlestick is not very significant, nor is it part of a significant chart pattern.
Despite these bullish signs, it is true that the greenback remains within a valid long-term bearish trend, with its price lower than it was both 3 and 6 months ago.
I remain nervous to trade against the US Dollar over the coming week unless we see a strong bearish reversal soon from the resistance at 102.80.
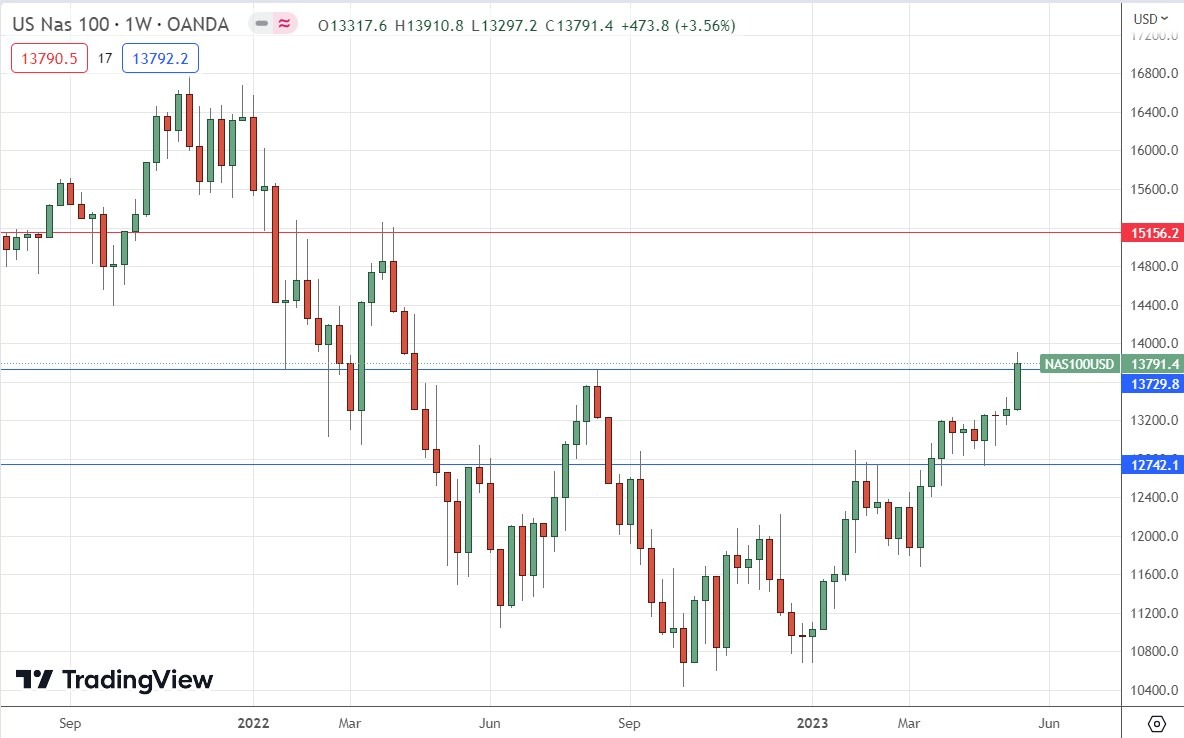
We saw the strongest rise in the NASDAQ 100 Index over the past week in over two months. The picture here is very bullish, for several reasons:
- The weekly candle closed strongly higher, at its highest closing price seen in over one year.
- The weekly candlestick closed well above the resistance level which I had identified at 13730, showing we have a bullish breakout situation.
- Stock markets are generally bullish, and the S&P 500 Index is also technically bullish, but less so.
There are no key resistance levels until the 15000 area, so the price has lots of room to rise.
The NASDAQ 100 Index still looks like a buy, but if it quickly retreats below 13730, bulls should be concerned.
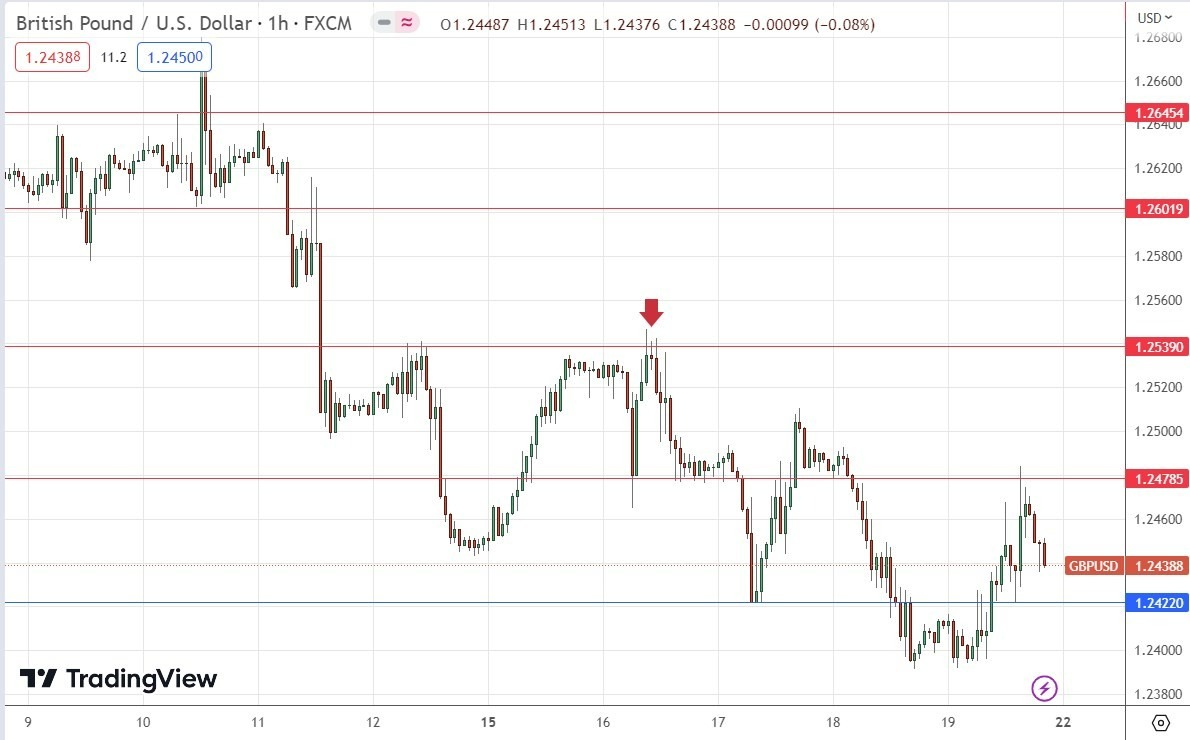
The GBP/USD currency pair printed a weakly bearish near-doji candlestick, with a relatively small range, which closed above the key support level at $1.2422.
Last week saw another advance by the US Dollar, which calls into question the long-term bullish trend in this currency pair, although the bullish trend remains technically valid. However, it is worth noting that the price here still has not fallen by a great deal from the recent long-term high, and that the British Pound is holding up against the resurgent Dollar much better than the Euro and some other major currencies are.
Traders willing to take a trade with a potentially large reward to risk ratio might look to buy any bounces at key support levels here over the coming week, at least until there is a daily close below $1.2300.
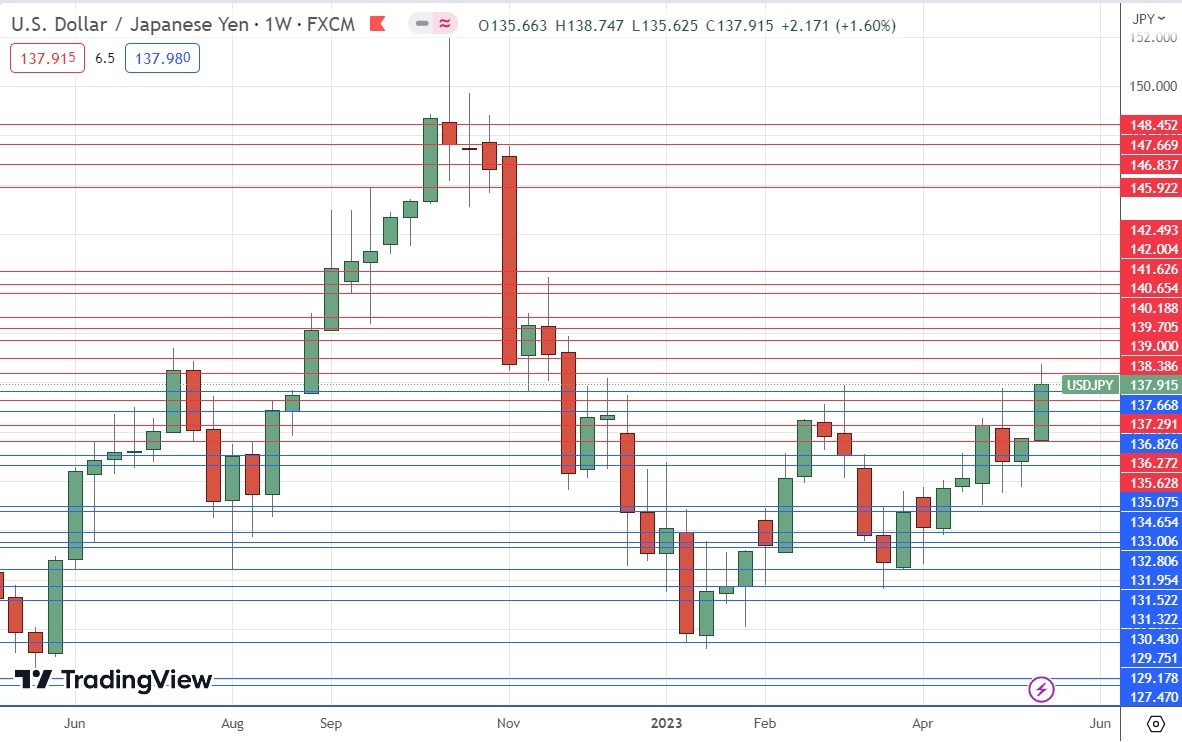
The USD/JPY currency pair rose firmly last week, printing a bullish piercing candlestick which closed not very far from the high of its range.
We now see a valid long-term bullish trend, and last week’s close was the highest weekly close seen in the last 6 months.
We see long-term weakness in the Japanese Yen, so as the Dollar continues to rise, this currency pair comes into focus.
There are good technical reasons to be bullish but a careful look at the price chart below shows that the high price area above ¥138 has been a very pivotal point, so the nearby resistance levels might be too strong for bulls to break soon.
As a trend trader in major currency pairs, I am long of this currency pair and want to remain long unless we see a big drop. It is worth noting that volatility in the Yen is very high, so longer-term traders will need wide stop losses.
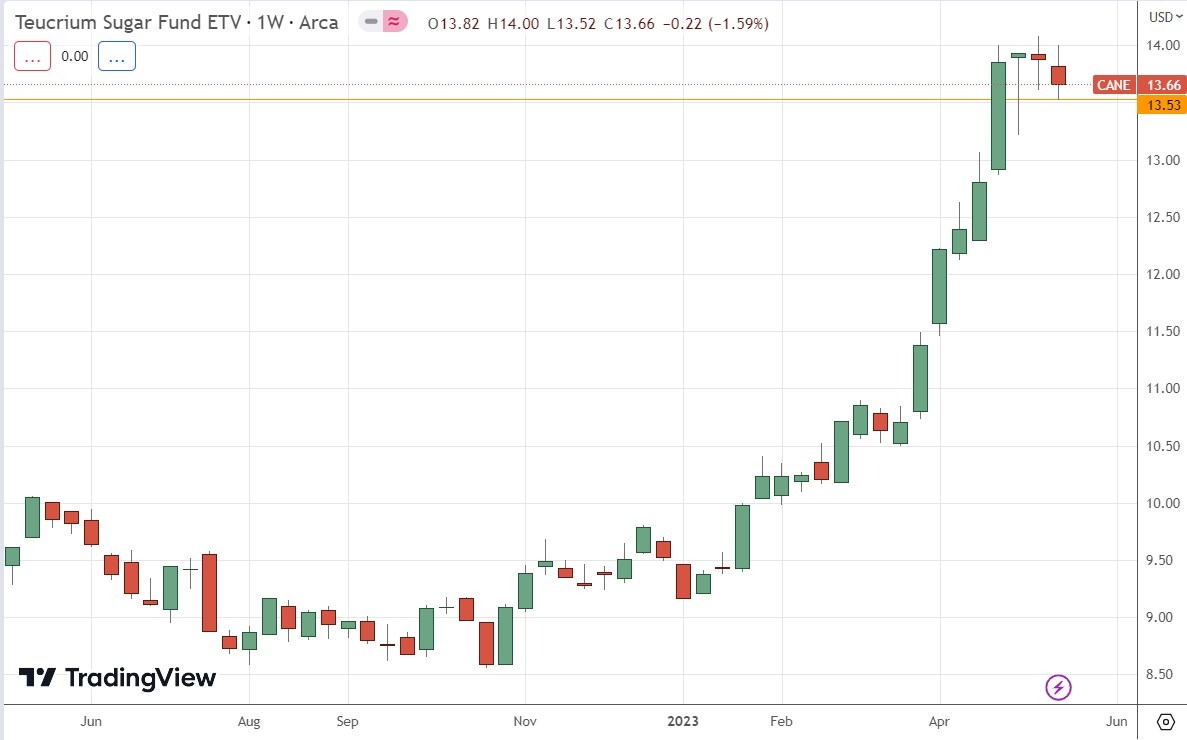
The Sugar ETF CANE has seen a more than 40% price rise since the start of 2023. After initially making quite a deep bearish retracement two three ago, it bounced back, but just has not been able to reclaim its former eye-watering bullish momentum.
However, the past week has seen only a slight fall, with the printing of a bearish candlestick. I feel that a deeper retracement producing a daily close below $13.50 might signify the end of the bullish trend.
It is always difficult to forecast where such strong trends might reverse, but bulls should be aware the price has gone up by a lot and the trend could be seen to be very over-extended. I would therefore prefer to wait for a consolidation and subsequent bullish breakout before entering a new long trade here.
There may be likely resistance levels at $14.25 and at $15.00.
It has historically been very worthwhile trading new 6-month high breakouts in commodities, using a volatility-based trailing stop.
The Cocoa ETF CANE has seen a more than 27% price rise since the start of 2023. It has been rising steadily since November, breaking to long-term highs a few weeks ago, and accelerating its bullish run. On Friday, it rose very strongly to make its highest daily close in 5 years, closing right on its high price of the day, both of which are bullish signs.
It is always difficult to forecast where such strong trends might reverse, but bulls should be aware the price has gone up by a lot and the trend could be seen to be very over-extended. I would therefore prefer to wait for a consolidation and subsequent bullish breakout before entering a new long trade here.
There may be likely resistance at $40.
It has historically been very worthwhile trading new 6-month high breakouts in commodities, using a volatility-based trailing stop.
I see the best trading opportunities this week as:
- Long of the NASDAQ 100 Index.
- Long of the USD/JPY currency pair.
- Long of the GBP/USD currency pair if we see a strong bullish bounce at a key support level.
Ready to trade our weekly Forex forecast? Here are the best Forex brokers to choose from.
[ad_2]
