[ad_1]
After doing a break and retest pattern, the pair will likely bounce back and retest the third resistance at 1.2640.
- Buy the GBP/USD pair and set a take-profit at 1.2640.
- Add a stop-loss at 1.2350.
- Timeline: 1-3 days.
- Set a sell-stop at 1.2415 and a take-profit at 1.2350.
- Add a stop-loss at 1.2530.
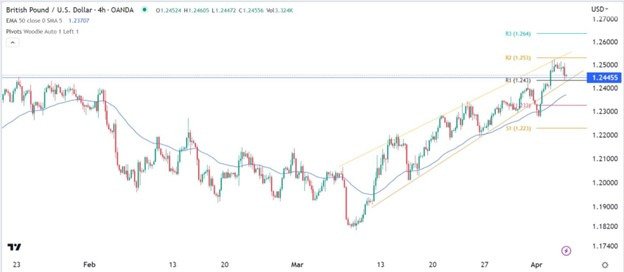
The GBP/USD pair pulled back slightly after the relatively weak economic data from the United States. It pulled back to a low of 1.2445, which was an important level of support. Still, the pair has still risen by more than 10% from its lowest point in 2022.
The US dollar rose slightly after a relatively hawkish statement by Loretta Mester, the head of the Cleveland Fed. In a statement, she said that the bank still needs to maintain a hawkish tone in a bid to fight inflationary pressures in the country.
She said that she supported moving rates above 5% in the next meeting. Also, she believes that interest rates should stay above 5% for a while. In its March meeting, the Fed decided to hike rates to between 4.75% and 5%.
Mester’s statement came after the US published a series of weak economic numbers. On Tuesday, JOLTs data showed that the number of vacancies in the country dropped below 10 million for the first time since 2021.
And on Wednesday, a report by ADP showed that the private sector added 145k jobs in March, sharply lower than the previous month’s 261k and the median estimate of 200k. These numbers came two days ahead of the official jobs numbers.
Meanwhile, America’s exports and imports dropped to $251 billion and $321 billion in February, pushing the trade deficit to over $70 billion. Another report by the Institute of Supply Management (ISM) showed that the non-manufacturing PMI dropped to 51.2 in March.
Therefore, these numbers mean that the American economy is slowing due to higher inflation and interest rates.
The only data to watch on Thursday will be the house price index from the UK. Analysts expect the data to show that the house price index dropped by 0.3% in March.
The GBP/USD pair has been in a strong bullish trend in the past few weeks. During this rally, the pair managed to move above the important resistance point at 1.2445, the highest point in January. It then retested this price in what is known as a break and retest pattern. The pair moved above the 50-period moving average and tested the second resistance of the Woodie pivot point.
Therefore, after doing a break and retest pattern, the pair will likely bounce back and retest the third resistance at 1.2640.

Ready to trade our free daily Forex trading signals? We’ve shortlisted the best UK forex broker in the industry for you.
[ad_2]