[ad_1]
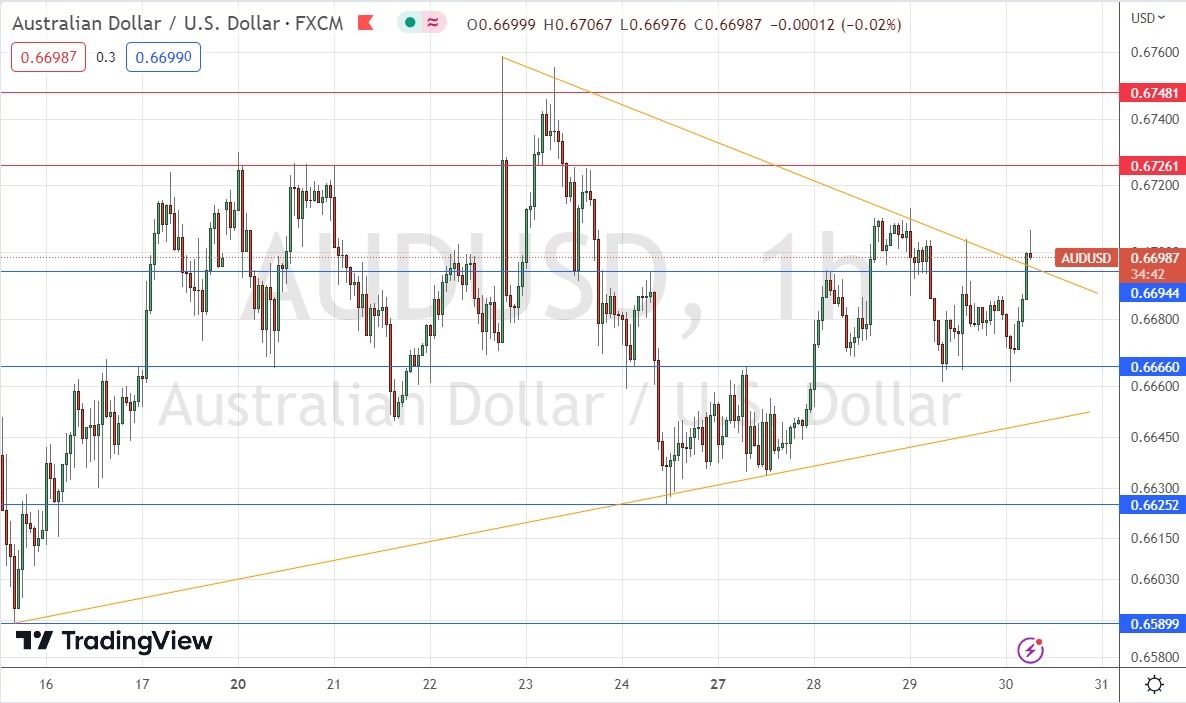
Price looking likely to break above the consolidating triangle chart pattern.
My last signal on 21st March produced a nicely profitable long trade from the bullish rejection of the support level which I had identified at $0.6669.
Risk 0.75%
Trades must be taken prior to 5pm Tokyo time Friday.
- Short entry following a bearish price action reversal on the H1 time frame immediately upon the next touch of $0.6726, $0.6748, or $0.6786.
- Put the stop loss 1 pip above the local swing high.
- Adjust the stop loss to break even once the trade is 20 pips in profit.
- Take off 50% of the position as profit when the price reaches 20 pips in profit and leave the remainder of the position to run.
- Long entry following a bullish price action reversal on the H1 time frame immediately upon the next touch of $0.6694, $0.6666, or $0.6625.
- Put the stop loss 1 pip below the local swing low.
- Adjust the stop loss to break even once the trade is 20 pips in profit.
- Take off 50% of the position as profit when the price reaches 20 pips in profit and leave the remainder of the position to run.
The best method to identify a classic “price action reversal” is for an hourly candle to close, such as a pin bar, a doji, an outside or even just an engulfing candle with a higher close. You can exploit these levels or zones by watching the price action that occurs at the given levels.
I wrote in my previous forecast that the AUD/USD currency pair was consolidating within a wide range – but that the support level within this wide range, which had already been pivotal, at $0.6669, looked very likely to be today’s pivotal point.
This was a great call as this support marked the low of the day, giving a chance to enter a nicely profitable long trade.
The technical picture now is more bullish, as we have seen a recovery of risk sentiment over recent days, which typically boosts the Aussie, and a failure to reverse significantly the long-term bearish trend in the US Dollar. This gives a headwind in the long direction.
We did see lower than expected Australian CPI data yesterday, which might have hurt the Aussie by lowering rate hike expectations, but this data release seems to have had little impact.
Technically, the price chart below shows that we are seeing the beginning of a bullish breakout from the consolidating triangle pattern, although at the time of writing this is not showing strong momentum. However, the line of least resistance looks likely to be upwards, but the price would have to overcome the minor resistance just above the $0.6700 handle to reach the nearest resistance level.
I will be prepared to take a long trade here if we get a bullish bounce at the support level identified at $0.6694, especially if the rejection of the confluent round number at $0.6700 is also obvious at the same time.

There is nothing of high importance due today regarding the AUD. Concerning the USD, there will be releases of Final GDP and Unemployment Claims data at 1:30pm London time.
Ready to trade our daily Forex signals? Here’s our selection of Australian Forex brokers worth checking out.
[ad_2]
