[ad_1]
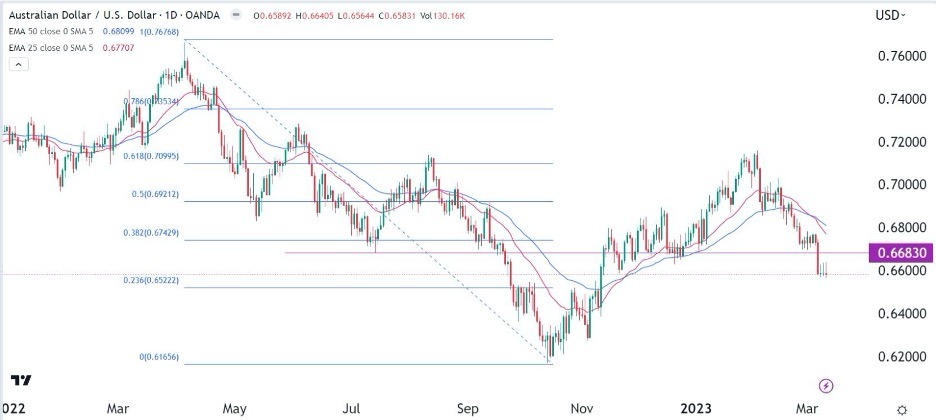
The daily chart shows that the AUD/USD pair has slowly formed a head and shoulders pattern, which is usually a bearish sign.
- Sell the AUD/USD pair and set a take-profit at 0.6400.
- Add a stop-loss at 0.6800.
- Timeline: 1-2 days.
- Set a buy-stop at 0.6680 and a take-profit at 0.6750.
- Add a stop-loss at 0.6600.
The AUD/USD price is hovering near the lowest level since November last year as elevated global risks push traders to the safety of the US dollar. It was trading at the psychological level of 0.6600 on Monday morning, which was much lower than the year-to-date high of near 0.7200.
The AUD/USD price continued dropping as traders embraced a risk-off sentiment, which pushed the US dollar index to the highest level in weeks. The pair dropped after the latest US jobs numbers that came out on Friday.
According to the Labor Department, the American labor market is still strong as the economy created more than 300k jobs. However, the unemployment rate rose from 3.4% in January to 3.6% in February. Wage growth also decelerated slightly in February.
The next key economic data to watch will come on Tuesday when the US publishes the latest consumer inflation data. Economists believe that inflation remained stubbornly high in February. Precisely, they expect that the headline consumer inflation dropped to 6.0% during the month.
Inflation is important data since it forms part of the Fed’s dual mandate. In a statement last week, the Fed chair said that the bank will be data-dependent when making its next interest rate decision. As such, if the numbers are higher-than-expected, the Fed will likely hike by 0.50%.
The only hindrance will be the ongoing crisis in the banking sector. Last week, SVB became the biggest bank to collapse since the Global Financial Crisis (GFC). Some analysts believe that more regional banks could collapse this week. As such, because of the importance of the banking sector, it means that the Fed could slow its hikes if more banks collapse.
The only important economic data from Australia this week will be the upcoming consumer and business confidence data scheduled for Tuesday. Australia will also publish the latest jobs numbers on Thursday.
The daily chart shows that the AUD/USD pair has slowly formed a head and shoulders pattern, which is usually a bearish sign. The 25-day and 50-day moving averages have made a bearish crossover while the pair has moved below the 38.2% Fibonacci retracement level. Most importantly, it has formed a bearish flag pattern.
Therefore, there is a likelihood that the pair will have a bearish breakdown in the coming days, as sellers target the next key support level at 0.6522, which is along the 23.6% retracement level.

[ad_2]