Natural gas futures failed to hold the previous day’s gains, instead pulling back ahead of what is expected to be another smaller-than-usual storage draw in the government inventory report due later in the day.
Spot natural gas prices (CFDS ON NATURAL GAS) declined slightly during their early trading on Wednesday, to record slight daily losses until the moment of writing this report, by -0.04%. It settled at $2.583 per million British thermal units, after declining slightly during yesterday’s trading by -2.42%.
Natural gas futures failed to hold the previous day’s gains, instead pulling back ahead of what is expected to be another smaller-than-usual storage draw in the government inventory report due later in the day. April gas futures settled at Nymex on Wednesday at $2.551 per million British thermal units, down 13.6 cents from Tuesday’s close, while May futures fell 12.7 cents to $2.713.
After some huge swings over the weekend, weather models have flattened a bit with no major changes in recent cycles, NatGasWeather said mainly weather data was solidly bullish late last week, but slightly bullish in recent data.
Meanwhile, the US Energy Information Administration (EIA) said inventories on February 24 stood at 2,114 billion cubic feet. That’s 451 billion cubic feet above the previous year’s levels and 342 billion cubic feet above the five-year average.
Ahead of the next EIA report, analysts expect another small decline. For comparison, the EIA report recorded a decline of 126 Bcf for the same week last year, and a five-year average decline of 101 Bcf.
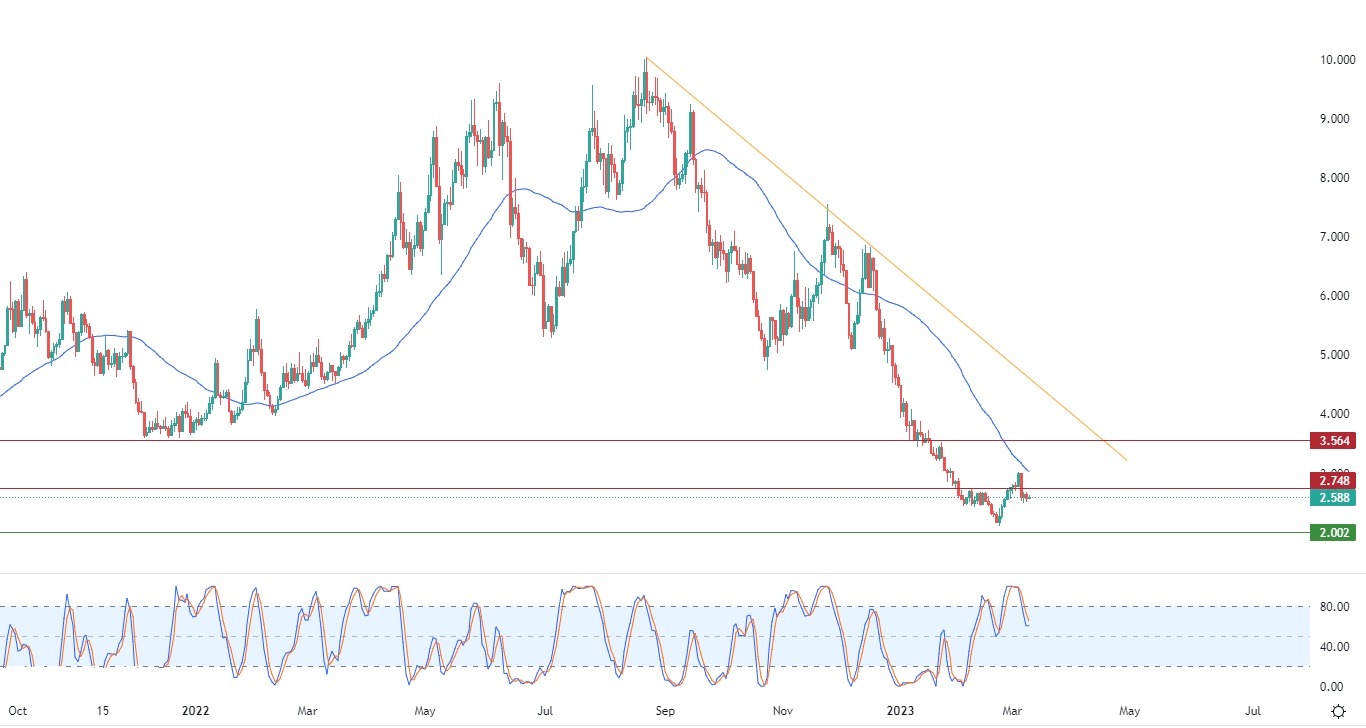
Technically, the price settles below the resistance level of 2.748, and this doubles the negative pressure on it. Especially amid the continuation of the negative pressure for its trading below the simple moving average for the previous 50-day period. Under the control of the main bearish trend in the medium term along a slope line, as shown in the attached chart for a period (daily). In addition to that, we notice the presence of negative signals on the relative strength indicators, after reaching highly overbought areas.
Therefore, our expectations indicate a decline in natural gas during its upcoming trading, especially as long as it stabilizes below 2.748, to target the support level at 2.00.

Ready to trade FX Natural Gas? We’ve shortlisted the best commodity brokers in the industry for you.
