[ad_1]
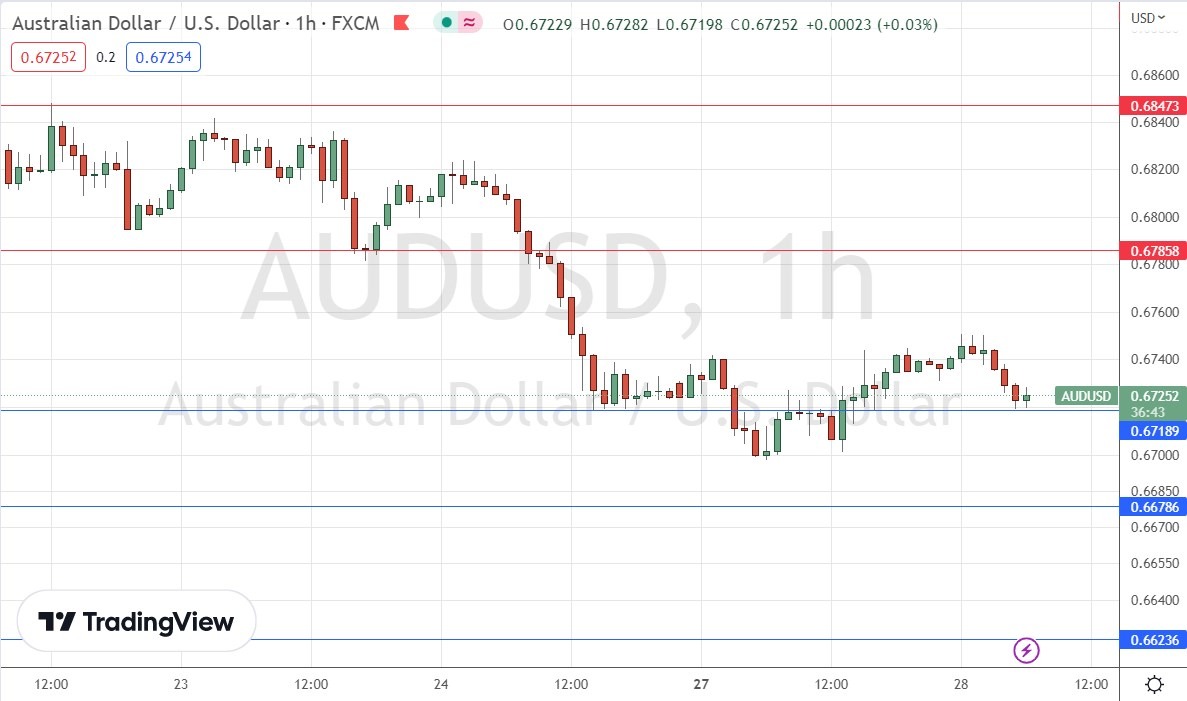
If support holds, we may see a bullish head and shoulders pattern complete.
My previous signal on 23rd February was not triggered as the bullish price action took place below the support level which I had identified at $0.6790.
Risk 0.75%
Trades must be taken prior to 5pm Tokyo time Wednesday.
- Go short following a bearish price action reversal on the H1 time frame immediately upon the next touch of $0.6786 or $0.6847.
- Put the stop loss 1 pip above the local swing high.
- Adjust the stop loss to break even once the trade is 20 pips in profit.
- Take off 50% of the position as profit when the price reaches 20 pips in profit and leave the remainder of the position to run.
- Go long following a bullish price action reversal on the H1 time frame immediately upon the next touch of $0.6719, $0.6679, or $0.6624.
- Put the stop loss 1 pip below the local swing low.
- Adjust the stop loss to break even once the trade is 20 pips in profit.
- Take off 50% of the position as profit when the price reaches 20 pips in profit and leave the remainder of the position to run.
The best method to identify a classic “price action reversal” is for an hourly candle to close, such as a pin bar, a doji, an outside or even just an engulfing candle with a higher close. You can exploit these levels or zones by watching the price action that occurs at the given levels.
I wrote in my previous forecast that the AUD/USD currency pair was approaching what looked to be a very pivotal point at $0.6850. This was a good call, as the price was no even quite able to reach this level, and has traded lower since then.
The technical picture today is indicative of the start of the second shoulder of a bullish head and shoulders chart pattern, based off the key support level shown in the price chart below at $0.6719. Although risk sentiment is generally against a rise in this pair, it made a minor recovery yesterday, and might possible get a boost from data releases due later today.
The support at $0.6719 looks very pivotal now. If it holds, we will probably see the price advance to the neckline at the big quarter-number of $0.6750, and if that level is broken, it should continue to advance to the next resistance level at $0.6786.
However, I see the most potentially exciting trade opportunity here as likely to come from a bearish breakdown below the pivotal support at $0.6719, as this would represent a bearish failure of the bullish head and shoulders chart pattern, and it could uncover a lot of stops and likely send the price plunging, especially if accompanied by a renewed risk selloff in the wider market.
If we get two consecutive lower hourly closes below $0.6719 later, the price will be likely to continue downwards to reach at least $0.6679.
The release of Australian CPI (inflation) data later during the Sydney session could be very important, especially if it comes in significantly lower than the expected annualized rate of 8.1%, as such a lower number would likely send the price here lower.

Regarding the USD, there will be a release of CB Consumer Confidence data at 3pm London time. Concerning the AUD, there will be a release of CPI (inflation) data at 12:30am.
Ready to trade our daily Forex signals? Here’s our selection of the best Forex trading platforms in Australia worth checking out.
[ad_2]
