[ad_1]
A bearish breakout can also not be ruled out.
Bearish view
- Sell the BTC/USD pair and set a take-profit at 21,400.
- Add a stop-loss at 23,200.
- Timeline: 1-2 days.
Bullish view
- Set a buy-stop 22,775 and a take-profit at 24,000.
- Add a stop-loss at 21,000.
Bitcoin price diverged from American stocks even as concerns about inflation and regulations continued. The BTC/USD price found support at 21,394, where it failed to move on February 10 and Monday. As it rose, the Dow Jones and S&P 500 indices fell by 130 points.
BTC/USD 4H chart analysis
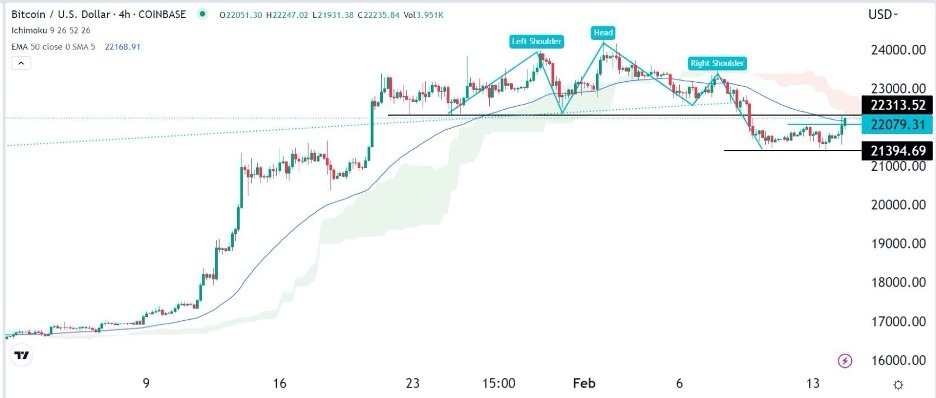
The BTC/USD pair found strong support at 21,395, which was its lowest point on January 20. It formed a small double-bottom pattern whose neckline was at 22,080. In technical analysis, this pattern is usually a bullish sign.
Bitcoin has then retested the important resistance level at 22,313 (January 25 low). This price was the neckline of the head and shoulders pattern that formed between January and last week. A head and shoulders pattern is a bearish sign.
Therefore, it seems like the pair has formed a break-and-retest pattern, which is usually a sign of a trend continuation. It remains below the Ichimoku cloud indicator and the 50-period exponential moving average (EMA).
As such, the outlook of Bitcoin at this moment is neutral with a bearish bias. A volume-supported move above the resistance point at 22,400 will mean that the break and retest pattern has been invalidated. If this happens, Bitcoin will likely enter the Ichimoku cloud and move to the resistance at 23,500.
A bearish breakout can also not be ruled out. More downside will be confirmed if sellers manage to push the BTC/USD pair below the double-bottom level of 21,394 will mean that there are still more sellers ready to push Bitcoin lower. Such a move will bring a psychological level of 20,000 to view.

Bitcoin price forecast (daily chart)
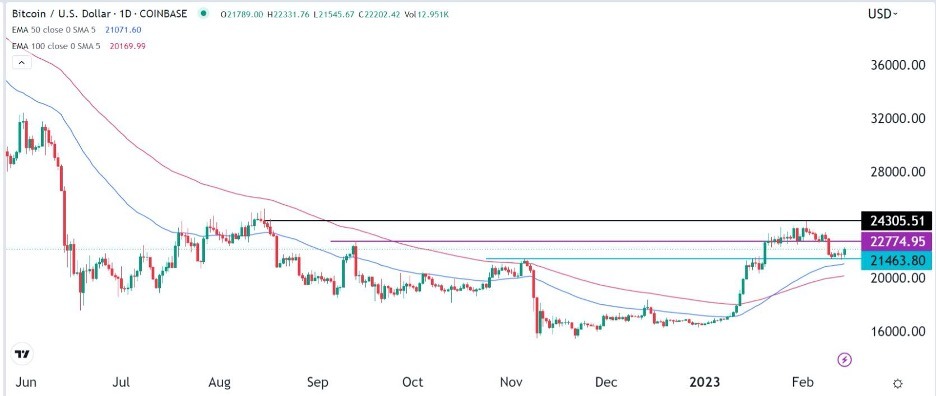
The daily chart shows a clearer view of what is happening. Bitcoin flipped the resistance at $21,463 into support on January 20th. It then rose and found another major resistance at 24,305 (August 2022 high). Recently, it has retested the support at 21,463 and it remains above the 50-day moving average. The 50-day and 100-day MAs have made a bullish crossover pattern.
Therefore, like in the 4H chart, the outlook of Bitcoin will depend on whether there are enough sellers to push it below the support at $21,463. If there are, it will signal that the end of the recent bull run is near. On the other hand, moving above the resistance at 22,775 will point to a retest of 24,305.

[ad_2]