[ad_1]
Stock markets are starting to look more bullish as the S&P 500 Index makes a golden cross, while the US Dollar gained a lot of ground Friday after the strong NFP data, calling into question some of the trends against the greenback.
The difference between success and failure in Forex / CFD trading is highly likely to depend mostly upon which assets you choose to trade each week and in which direction, and not on the exact methods you might use to determine trade entries and exits.
So, when starting the week, it is a good idea to look at the big picture of what is developing in the market as a whole, and how such developments and affected by macro fundamentals, technical factors, and market sentiment. There are a few valid long-term trends in the market right now, which might be exploited profitably. Read on to get my weekly analysis below.
Fundamental Analysis & Market Sentiment
I wrote in my previous piece on 5th February that the best trade opportunities for the week were likely to be long of the S&P 500 Index (potentially for a long-term investment) and the EUR/USD currency pair once it makes a higher daily close above the previous two days. The S&P 500 Index fell by 0.71%, while the EUR/USD currency pair made a higher close on Thursday but then ended Friday down by 0.57%. These trades gave an average loss of 0.64%.
The news is dominated by a firmer expectation that the US Federal Reserve will implement another two rate hikes of 0.25% each over the near term, which has sent stocks lower, the US Dollar higher, and US treasury yields rising firmly. This was driven only by comments during the past week made by Fed Chair Jerome Powell and Fed Member Williams.
The other major item was the Reserve Bank of Australia’s hawkish rate hike of 0.25% to 3.35%, and the inclusion of language indicating further hikes are likely in its Statement. However, this was not enough to produce a gain for the Australian Dollar which cold hold up in the market.
The final significant release last week was UK GDP data which showed that month on month, UK GDP fell by 0.5%, worse than the decline of 0.3% which had been widely expected. The UK remains the only G7 nation expected to go into recession during 2023, and the data may have contributed to the Pound’s decline towards the end of last week.
There were a couple of other data releases concerning the US and Canada, but none of them contained any major surprises or moved the market significantly.
Global stock markets ended the week mostly lower, with the notable exception of the UK FTSE 100 Index. The Forex market saw the greatest strength in the Swiss Franc last week, with the Euro the weakest major currency.
Rates of coronavirus infection worldwide again dropped last week for the seventh consecutive week according to official data, with the lowest overall numbers seen since June 2020, shortly after the start of the pandemic.
The Week Ahead: 13th February – 17th February 2023
The coming week in the markets is likely to see a higher level of volatility compared to the past week, as there are several major data releases due concerning inflation. They are, in order of importance:
- US CPI data
- UK CPI data
- US PPI data
- Switzerland CPI data
- US Retail Sales data
- UK Unemployment data
- Australian Unemployment data
- Governor of RBA testifying before Australian Parliament
The release of US inflation data is going to be extremely important and will likely be the main driver of stock and Forex markets over the coming weeks. US CPI is expected to decline further to an annualized rate of 6.2% from last month’s 6.5%
Technical Analysis
US Dollar Index
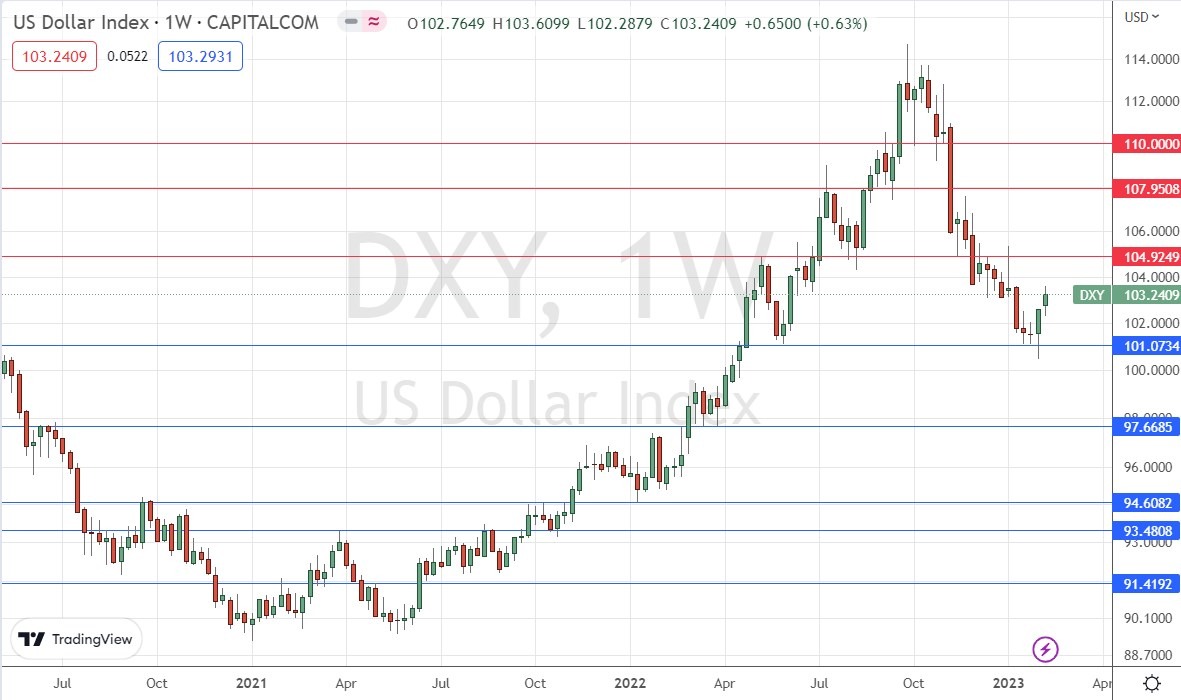
The weekly price chart below shows the U.S. Dollar Index printed a bullish candlestick, the week after having convincingly rejected the support level shown at 101.07, which typically signifies a continuing reversal of direction.
Despite these bullish signs, the Dollar remains within a long-term bearish trend, with the price continuing to trade well below its levels of both 3 and 6 months ago.
I do not like to trade against long-term trends, but there are increasing signs that the bearish trend is now going to pause or make a deeper bullish retracement, so traders should be cautious and watch out for this. Any trades against the US Dollar should probably only be taken once we see bullish price action in the daily time frame.

EUR/USD
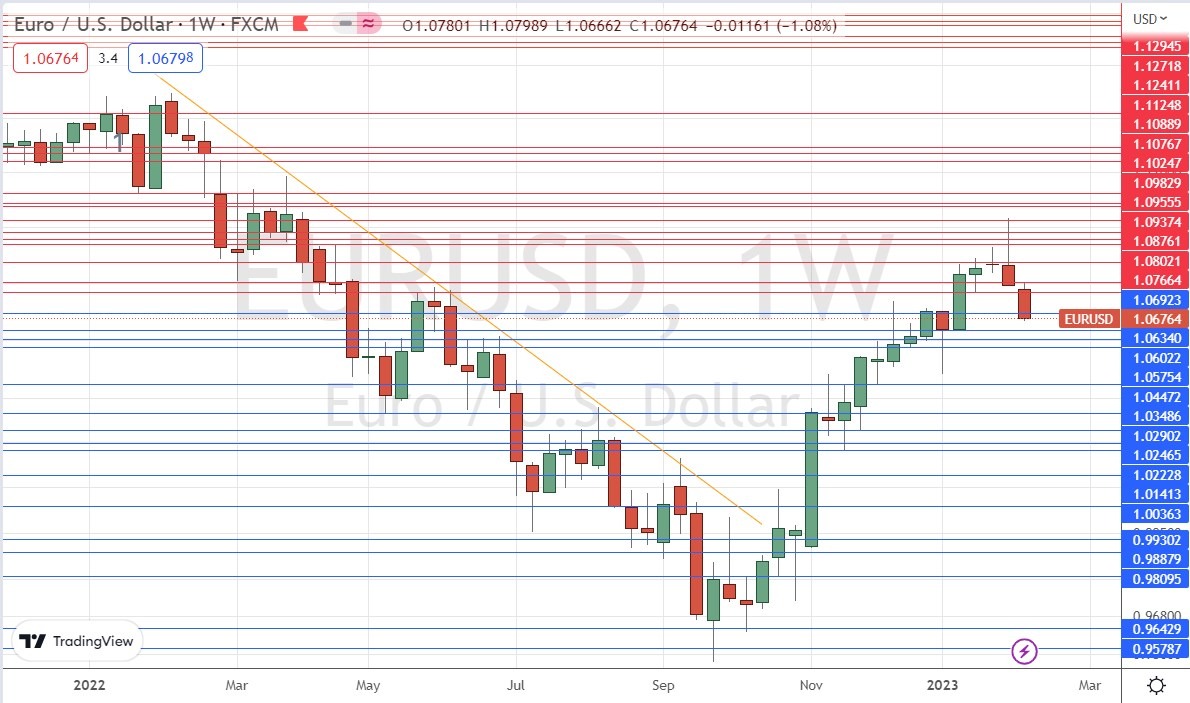
Last week saw the EUR/USD currency pair print a firm bearish candlestick after declining from a high over the previous week – this is a bearish sign.
In addition to the bearish price action, the price has now fallen by 3 days ATR, so the bullish trend is quite likely over. It should however be noted that this currency pair often makes deep pullbacks within trends.
The fundamentals on the Euro remain bullish, with the ECB currently positioned as one of the most hawkish central banks.
I think traders should watch this currency pair carefully over the coming week. If the bearish momentum continues, there may be good short day trading opportunities here for skilled traders.

S&P 500 Index
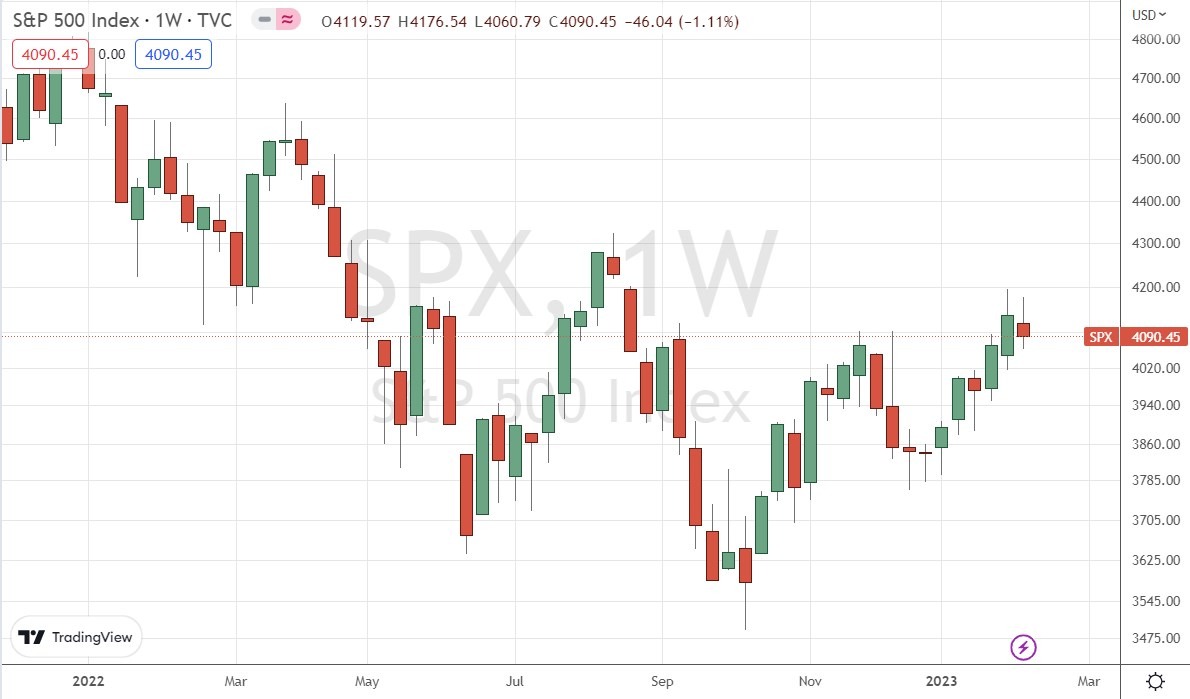
Last week again saw the S&P 500 Index fall, just as almost every other major stock index fell, printing a bearish inside candlestick. It is notable that although the price action of the last few days has certainly been bullish, the price has not fallen by a great deal.
The daily price chart still shows a valid golden cross (or bull cross), where the 50-day MA crosses over the 200-day MA, valid since Thursday the previous week. Such a cross historically indicates the beginning of a major bull move, so it could be a great long-term buy signal.
I am not sure whether the Index is likely to rise or fall over the coming week. On the bullish side, we have seen firmer upwards movement over recent weeks indicating a more bullish market. However, we also see higher rate expectations and rising US treasury yields which tend to indicate flat or falling stock markets ahead.
Currently, the NASDAQ 100 Index looks very similar technology to the S&P 500 Index.

2-Year US Treasury Yield
Us Treasury Yields rose last week, notably the 2-year yield, after the Federal Reserve made it clear the previous week that further rate hikes and a higher terminal rate of 5.25% are likely to be on the table for the next few months.
Technically, the chart looks very bullish: we see a bullish near-doji inside candlestick, followed by a bullish pin bar, and then a very firm bullish candlestick that closed very close to its high. The yield ended the week quite close to its highest daily close made in years at 4.729%.
I would not enter a long trade here until we get a daily close above 4.729%, which I think is unlikely to happen this week.

Bottom Line
I think longer-term traders may be wise to sit on the sidelines this week. However, I see a long-term investment opportunity as valid in the S&P 500 Index, and potential day trading opportunities in the EUR/USD currency pair on the short side if the bearish momentum persists. I also see a long trade in the US 2-Year Treasury Yield in the unlikely event that we see a daily close above 4.729%.
Ready to trade our Forex weekly analysis? We’ve shortlisted the best Forex trading brokers in the industry for you.
[ad_2]
