[ad_1]
The difference between success and failure in Forex / CFD trading is highly likely to depend mostly upon which assets you choose to trade each week and in which direction, and not on the exact methods you might use to determine trade entries and exits.
So, when starting the week, it is a good idea to look at the big picture of what is developing in the market as a whole, and how such developments and affected by macro fundamentals, technical factors, and market sentiment. There are some valid long-term trends in the market right now, which might be exploited profitably. Read on to get my weekly analysis below.
Fundamental Analysis & Market Sentiment
I wrote in my previous piece on 29th January that the best trade opportunities for the week were likely to be long of Gold in USD terms and the EUR/USD currency pair. Gold in USD terms fell by 3.22% and the EUR/USD currency pair ended the week lower by 0.67%. These trades gave an average loss of 1.95%.
The news is dominated by the US Federal Reserve and the extremely strong US non-farm payroll data released last Friday.
On Wednesday, the Federal Reserve hiked rates by 0.25%, as had been widely expected, and delivered a Statement that maintained language suggesting further rate hikes were possible within the current cycle. Despite this, the markets reacted to Jerome Powell’s press conference as though it were giving a dovish policy tilt, sending the US Dollar strongly lower and the US stock market higher. Markets began implying an end to rate hikes. The next day, Thursday, saw the S&P 500 make a golden cross, which is typically seen as a sign that a new bull market has begun.
The next day, Friday saw the release of US non-farm payrolls and average earnings data. The non-farm payrolls showed a much higher total of net new jobs that had been created the previous month – markets were expecting about 193k, but the actual total was 517k. The unemployment rate fell to 3.4%, a 50-year low.
Markets interpreted this strong jobs data as a sign that the Fed will need more rate hikes within the current cycle, so stock markets dropped and the US Dollar fell even more firmly. The sizes of the drops in many assets against the greenback suggests that some trends against the Dollar may be over. We will see as the new week opens whether risk sentiment bounces back naturally, or whether the NFP will send a longer-lasting chill over the markets.
Two major central banks conducted their monthly policy releases last week, the European Central Bank (the ECB) and the Bank of England (the BoE). Both hiked their interest rates by 0.50% as had been widely expected. The BoE indicated that only another 0.50% of hikes are expected within the current cycle and that it expects the coming UK recession to be weaker than it had previously expected. The ECB indicated a 0.50% rate hike will be forthcoming just next month, but that further hikes will be made during the current cycle. Markets are expecting another 1% in rate hikes within the current cycle until the ECB’s terminal rate of 4% is reached. These developments sent the Euro higher against the British Pound, although both currencies fell over the week against the Dollar.
The other major news of the week was Canadian GDP data coming in exactly than expected, showing a month-on-month increase of 0.1%.
There were a few other data releases concerning the US and New Zealand, but none of them contained any major surprises or moved the market significantly.
Global stock markets ended the week mostly higher, with the notable exception of the Hang Seng Index. The UK FTSE 100 Index reached a record high. The Forex market saw the greatest strength in the US Dollar last week, with the British Pound the weakest major currency.
Rates of coronavirus infection worldwide again dropped last week for the sixth consecutive week according to official data, with the lowest overall numbers seen since June 2020, shortly after the start of the pandemic.
The Week Ahead: 6th February – 10th February 2023
The coming week in the markets is likely to see a lower or similar level of volatility compared to the past week, as there are few major data releases. They are, in order of importance:
- Reserve Bank of Australia Cash Rate and Rate Statement – a hike of 0.25% to 3.35% is expected.
- The Chair of the US Federal Reserve and FOMC Member Williams will speak (separately).
- UK GDP data
- UK Monetary Policy Report Hearings
- The Governor of the Bank of Canada will speak.
- Canadian Unemployment data
- US Preliminary UoM Consumer Sentiment data
It is a public holiday in New Zealand on Monday.
Technical Analysis
US Dollar Index
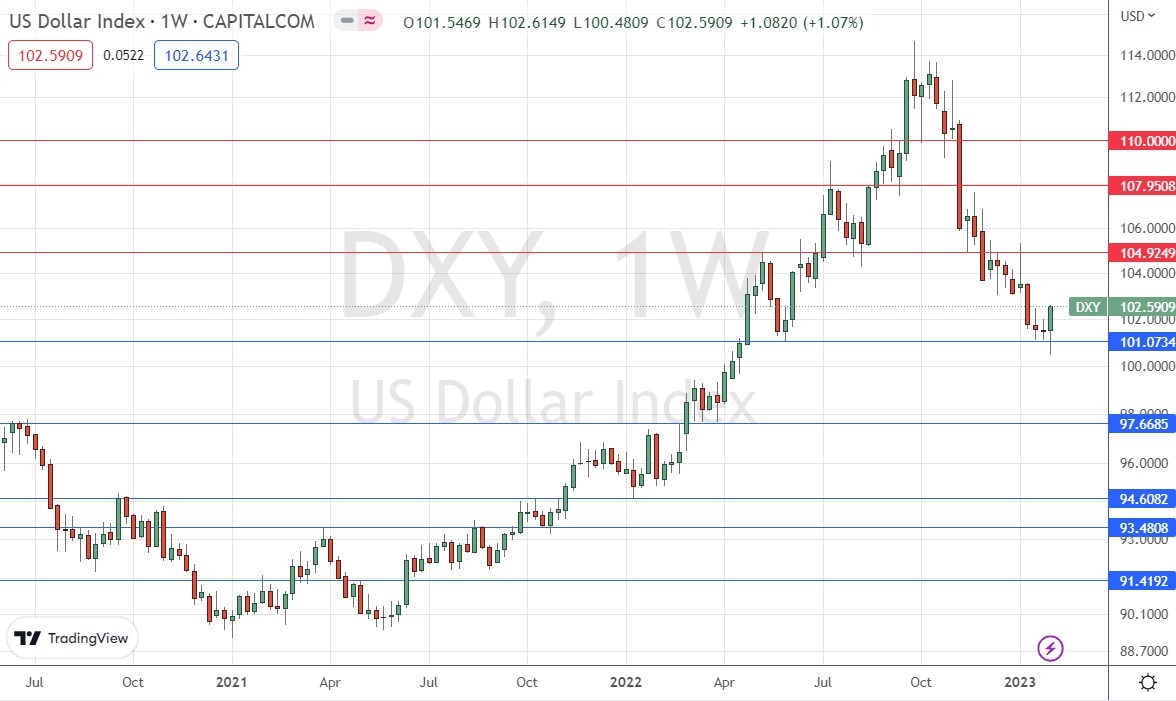
The weekly price chart below shows the U.S. Dollar Index printed a bullish outside candlestick, which typically signifies a reversal of direction. The low of the week strongly rejected the support level shown at 101.07 for the third consecutive week, which is a negative sign for bears.
Despite these bullish signs, the Dollar remains within a long-term bearish trend, with the price continuing to trade well below its levels of both 3 and 6 months ago.
I do not like to trade against long-term trends, but there are increasing signs that the bearish trend is now going to pause or make a deeper bullish retracement, so traders should be cautious and watch out for this. Trades against the US Dollar should probably only be taken once we see bullish price action in the daily time frame.

XAU/USD (Gold)
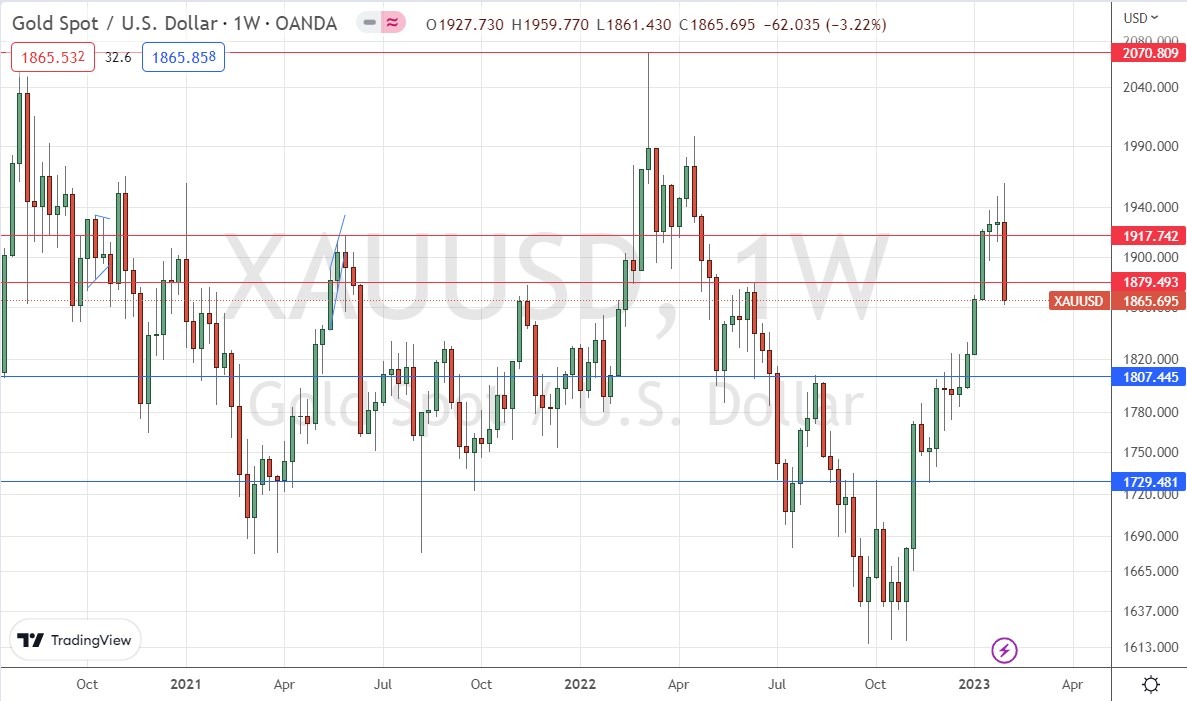
Last week Gold printed a large bearish outside candlestick which closed more than 3 days ATR lower than the highest recent close, suggesting that the bullish trend may be over, at least for a while.
The price is back below two resistance levels, which will make it hard for the price to get back up above $1918 into more bullish territory.
The price of Gold is most likely to go sideways this week.

EUR/USD
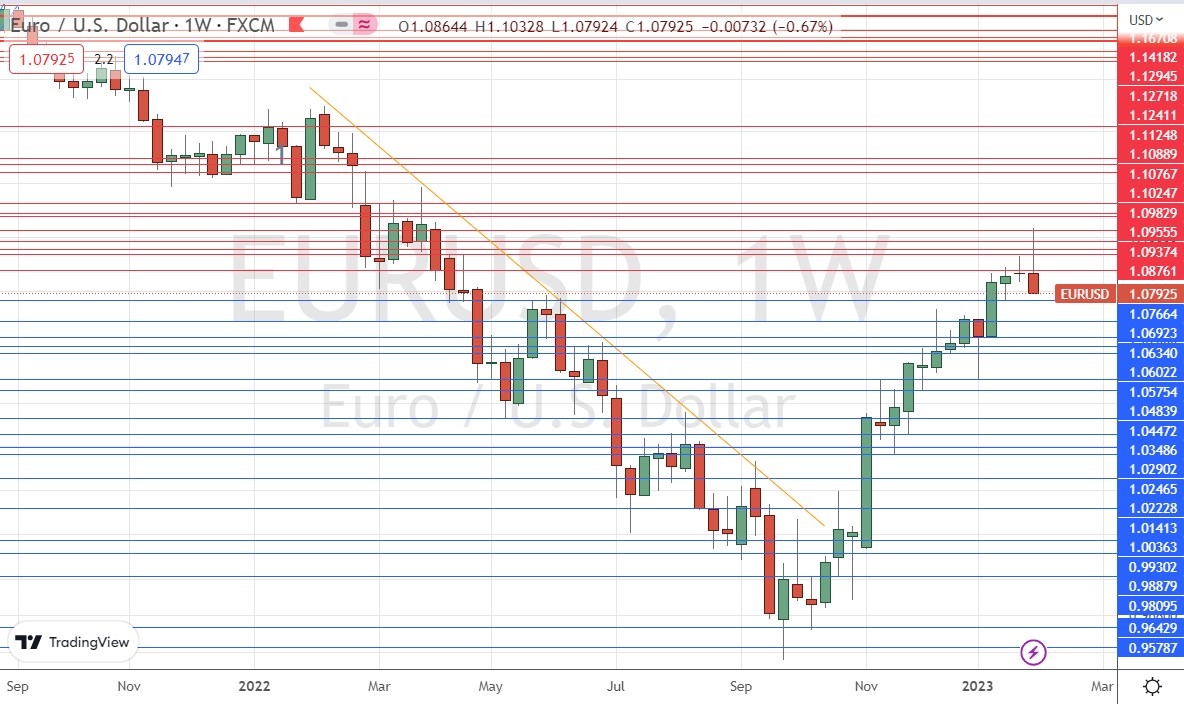
Last week saw the EUR/USD currency pair print a bearish outside candlestick after reaching a new long-term high – this is a bearish sign.
Despite the bearish price action, the price has not yet fallen by 3 days ATR, so the bullish trend remains statistically valid. It should also be noted that this currency pair often makes deep pullbacks within trends.
The fundamentals on the Euro remain bullish, with the ECB currently positioned as one of the most hawkish central banks.
For these reasons I believe that the price might rise this week, in line with its long-term trend. Long-term trends are statistically notably reliable in this currency pair. However, bulls should be careful and wait for more bullish price action in the daily time frame before entering any new long trade.

S&P 500 Index
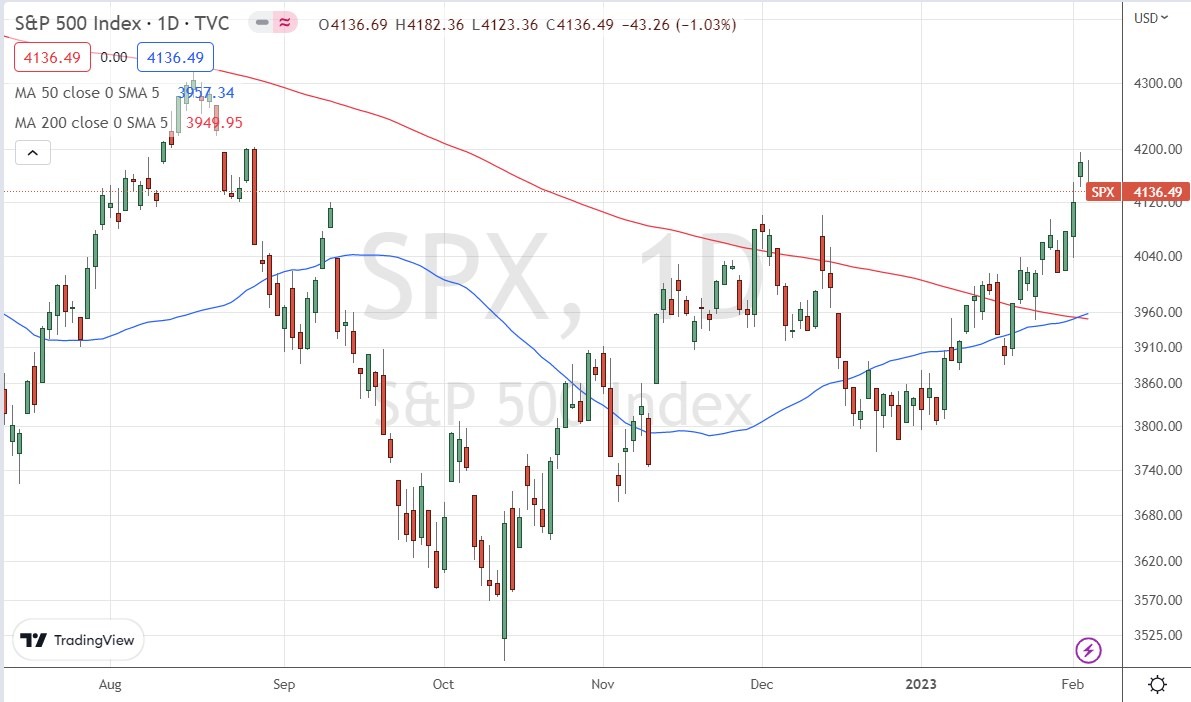
Last week again saw the S&P 500 Index rise just as almost every other major stock index rose. Thursday saw its highest daily close in more than 5 months.
The daily price chart below includes the 50-day and 200-day simple moving averages. This shows that a golden cross (or bull cross), where the 50-day MA crosses over the 200-day MA, took place last Thursday. Such a cross historically indicates the beginning of a major bull move, so it could be a great long-term buy signal.
Another bullish sign is that even after Friday’s down day, the price remained established above the key former resistance level at 4121.
I see this stock market index as likely to rise over the coming week, despite the renewed expectation of the market for more rate hikes over the near term by the US Federal Reserve.
Currently the NASDAQ 100 Index. Is looking less bullish than the S&P 500 Index, after it made a bearish rejection of the key resistance level at 12820.

Bottom Line
I see the best opportunity in the financial markets this week
Ready to trade our Forex weekly forecast? Here’s a list of some of the best Forex trading platforms to check out.
[ad_2]
