[ad_1]
The AUD/USD price will also react to the upcoming JOLTs job openings and ISM manufacturing PMI numbers.
Bullish view
- Buy the AUD/USD pair and set a take-profit at 0.7125.
- Add a stop-loss at 0.6965.
- Timeline: 1-2 days.
Bearish view
- Set a sell-stop at 0.7012 and a take-profit at 0.6945.
- Add a stop-loss at 0.7150.
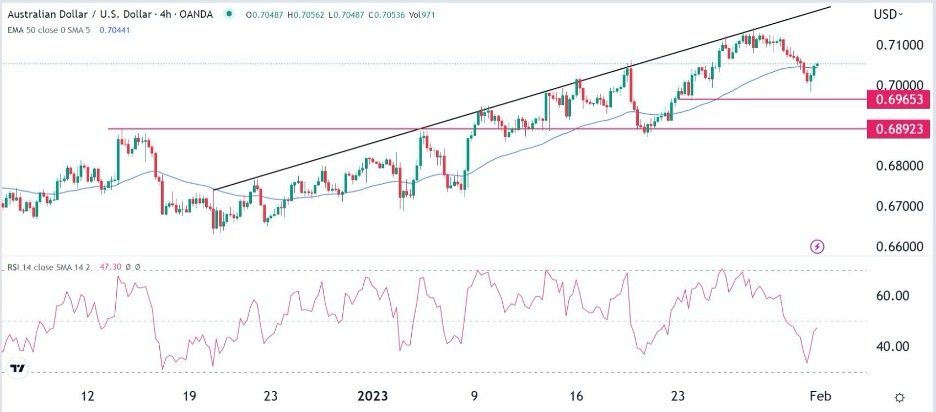
The AUD/USD formed a small hammer pattern on Wednesday morning as the focus remained solid on the upcoming FOMC decision. After slipping to a low of 0.6986 on Tuesday, the exchange rate pulled back to about 0.7055.
FOMC decision ahead
AUD/USD bulls have had a difficult past few days as the US dollar index (DXY) rallied to above $102 for the first time in days. They have seen the pair drop by about 1.36% from the highest point in 2023. The price action could have major implications after the Fed delivers its decision on Wednesday.
Economic data published recently have painted a picture of an economy that is grinding slowly. Layoffs by some of the bluest blue-chip companies like Salesforce, 3M, and Goldman Sachs have increased recently. At the same time, consumer confidence has dropped slightly while retail sales have plunged while bond yields have slipped.
Therefore, there is a reason to believe that the Fed will be forceful in a bid to push back on market expectations. A sign of a dovish tilt will make the situation worse in Fed’s eyes as cryptocurrencies and other risky assets will continue rising.
The AUD/USD price will also react to the upcoming JOLTs job openings and ISM manufacturing PMI numbers. Job openings are expected to come in at 10.25 million, down from the previous 10.48 million. ADP will also publish its estimate of the latest private payroll data, which will come two days ahead of the official NFP data.
AUD/USD prediction
The bears have been in control in the past four trading sessions. There are now signs that some bears are starting to take profits ahead of the FOMC decision. A hammer pattern, which is characterized by a long lower shadow and a small body has formed on the four-hour chart. In most cases, this pattern is usually followed by a few bullish bars.
The pair has also moved slightly above the 50-period moving average and the important support level at 0.6965 (January 23 low). It is also stuck below the ascending trendline that links the highest points since December last year.
Therefore, because of the hammer pattern, the pair will likely continue rising as buyers target the psychological level at 0.7125. The stop-loss of this trade will be at this week’s low of 0.6985.

[ad_2]